
Last week was quiet in terms of economic data and events affecting the markets following the Labor Day holiday. However, gold prices fell by around 1 percent this week. Analysts explain what awaits the yellow metal next.
Bulls lose hope in gold survey
The latest Kitco Weekly Gold Survey shows that last week’s optimism has escaped the precious metals market. Less than half of retail investors expect gold prices to make gains next week. Most market analysts have returned to the bearish sentiment. 13 Wall Street analysts voted in this week’s Gold Survey. Four experts (31%) expect gold prices to rise next week. Five analysts (38%) predict that prices will fall. The other four analysts (31%) expect gold to follow a sideways course during the week ending September 15.
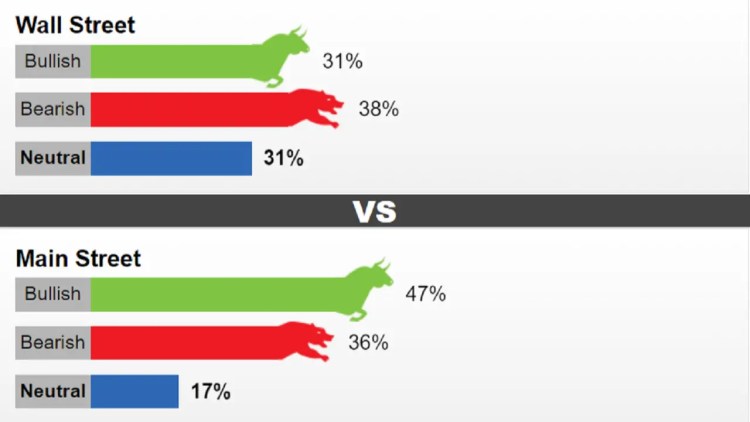
Participants, meanwhile, cast 474 votes in online polls. 222 (47%) of respondents predict that gold will rise next week. Another 169 (36%) expect a decline. 83 people (17%) state that they will remain neutral in the near term. The latest survey shows that retail investors expect gold prices to trade around $1,933 next week.
Sean Lusk: There is no hope for gold in the short term!
Sean Lusk, Co-Director of Commercial Hedging at Walsh Trading, says gold’s performance is still relative to the US dollar. He also states that he does not think the dollar will weaken anytime soon. In this context, the analyst makes the following assessment:
While there was some unease in equities, the dollar really shot up here as DXY rose to 105. In the long run, I am bullish. However, in the near term this seems like technical nonsense. The charts tell us that the short-term rallies are sold out. Also, I suspect that will be the case next week as well. We will make more long-term purchases from the market.
Colin Cieszynski expects a jump in gold price
On the other hand, Colin Cieszynski, Chief Market Strategist at SIA Wealth Management, likes what the charts tell him. In this regard, Cieszynski shares the following prediction:
I am bullish on gold for next week. Technical indicators such as the price holding its 20-day average and the oscillators turning upwards suggest that gold could make a bounce here.
James Stanley: Performance depends on US CPI and ECB stance
Forex.com Senior Market Strategist James Stanley believes the CPI and ECB will “probably be the deciding factor” for how gold will perform next week. The analyst explains his views on this issue as follows:
Since spot prices are holding above the 1.903-1.910 support, I am entering the week with an upward trend. I think it is possible for gold to strengthen around the CPI. But I’m more uncertain about the ECB. Lagarde has been giving evasive answers lately. This raises questions about whether they will actually raise interest rates. If they increase it could mean bearishness for gold. It could also erase any increase in the CPI. The real question here is whether gold can hold $1,900 before the Fed’s interest rate decision a week later.

Critical levels for Alton price
Bannockburn Global Forex Managing Director Marc Chandler believes gold prices could break in either direction next week. “I thought gold was poised to rise last week as it flirted with the $1,950 region a week ago,” Chandler said. However, the strong dollar and hard exchange rates pushed the yellow metal back to around $1,915.35 (near the 20- and 200-day moving averages).” says.
The analyst expects the US headline CPI to rise for the second month in a row on Wednesday. However, he notes that the market “seems to have once again rejected the two-year yield from moving above 5.0%.” Based on this, the analyst draws attention to the following levels:
A nearby resistance band is likely $1,935-40. A break above this could encourage another run at $1,950. On the other hand, a break through $1,915 could cause gold to retest August lows near $1,900 and possibly $1,885.
Adam Button: I’m not super bullish on gold so far!
Forexlive.com Chief Currency Analyst Adam Button thinks bond yields are the key benchmark for both gold and stocks these days. He also predicts a limited upside for the precious metal until late autumn. The analyst comments:
Currently the bond market controls all other markets. It’s pretty much neck and neck with stocks and everything else. Yields are rising, everything else is falling. However, I think interest rates were artificially pushed up earlier in the month due to interest loss sales by companies. This will ease as corporate debt is issued, driving down yields, which will translate into higher gold prices. I’m not super bullish on gold until mid-November, when it will be clear that the Fed has finished raising interest rates.
Daniel Pavilonis: Gold is stuck in a range
RJO Futures Senior Commodity Broker Daniel Pavilonis believes that interest rates remain the key driver for gold prices. That’s why he says he will continue to rein in gold prices. Pavilonis explains the impact of this situation on gold prices as follows:
In terms of the coming week, I think we will see more of this range for gold between $1,900 and $2,000. It can’t go below that. Even if it goes down, it lasts for a very short time and then starts to rise again. I think the gold price is stuck in a range. Moreover, it will remain so for a while.

Different predictions come from analysts for the yellow metal
cryptocoin.com As you can follow, the gold price is struggling to gain upward momentum. However, it also maintains the $1,900 level. Mark Leibovit, publisher of VR Metals/Resource Letter, said, “Hold longs as the dollar rises. All in all, this is a short-term bearish trend.” He warns.
Adrian Day Asset Management President Adrian Day predicts that gold prices will rise next week. “Even when the strength of the dollar is taken into account, the sales were overkill,” Day says.
Kitco’s Jim Wyckoff sees downside risk for the precious metal next week. “Stable decline,” Wyckoff said. A downtrend on the daily bar chart means that the path of least resistance for prices is down from the horizontal.” makes the comment.


