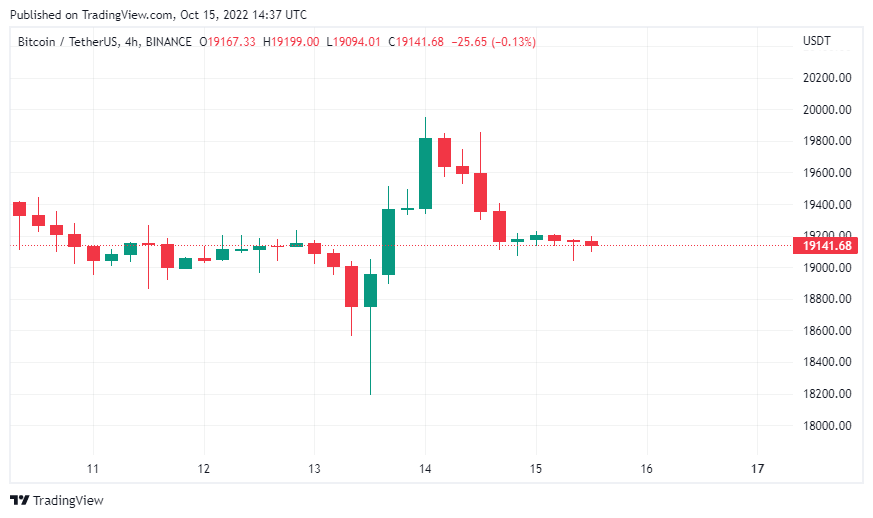
After US inflation data released on October 13, Bitcoin capitulated to a 4% drop. The good news is that it bottomed out at $18,319.82 despite breaking $19,000. Now, as buyers are busy pushing the price back to $20,000, new analysis shows that the overall sentiment is bearish as the futures premium slumped below 1% last month.
Bitcoin rebounds after extensive drop
After the US inflation data for September, the Bitcoin price has been fluctuating for 24 hours. According to the Consumer Price Index, inflation in the USA increased by 0.6% in September compared to August. Although the CPI, which you follow closely in the markets, triggered sales at the beginning, the decline did not last long in general. Bitcoin had an opportunity to recover quickly in the hours following the price drop. Currently, it is trading above $19,000.
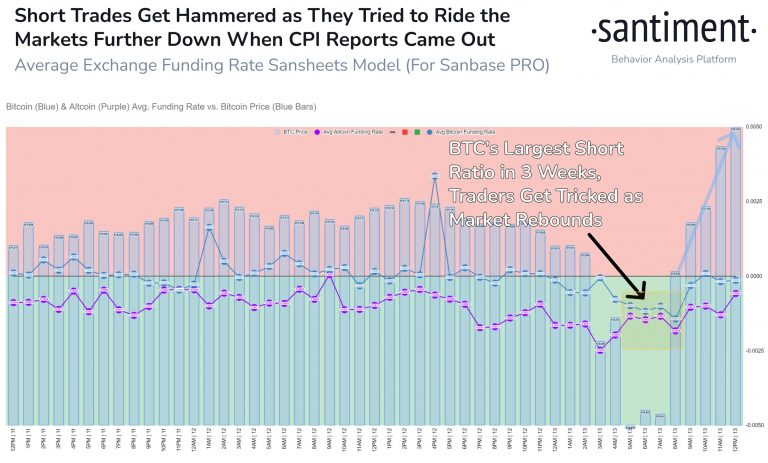
As soon as the inflation data came out, investors preferred to sell heavily. However, the hours that followed caught the shorts off guard. On-chain data provider Santiment summarized what happened during those hours:
Investors are heavily shorting Bitcoin and altcoins as news of inflation breaks out. When BTC hit the 3-week high long and short exchange rate, prices reversed course and started to rise. Many positions taken against crypto have been liquidated. Prices move towards the least expectation of the crowd.

Where is Bitcoin going next: $14,000 or $24,000?
Many analysts are confident that Bitcoin will fluctuate for a while. One of the pillars of this is that the Dow Jones Industrial Average and other indices rounded Wall Street to a solid 2% rally in a single day. As a result, Bitcoin follows the movements of traditional markets as it shares a close correlation with US stocks.
However, if Bitcoin fails to maintain $19,000, there is a possibility that it will drop to $16,900 and then to $14,000. In a statement to Bloomberg, Cici Lu, CEO of Venn Link Partners Pte, maps out these prices:
I don’t think we’re going to have an uptrend anytime soon. With just a little bit of negative regulatory news, we could break the lower end of Bitcoin’s most recent trading range of $19,000 to $24,000.

Also, Bitcoin derivatives traders were bearishly neutral. Over the past month, the Bitcoin futures premium has been below 1 percent. Historically, throughout all previous bear markets, Bitcoin hasn’t done well in October. As on-chain analyst Ali Martinez highlights:
Note that in all previous bear markets, BTC did not perform well in October.
#Bitcoin | Notice that in all previous bear markets, $BTC doesn't perform well in October. 👀 pic.twitter.com/Dug2ILtfrs
— Ali (@ali_charts) October 2, 2022
Short term prospects
Technical analyst Jim Wyckoff noted a “solid recovery after hitting a four-week low on Thursday” in his current BTC analysis. “The bears still have a slight overall technical advantage in the short term,” Wyckoff warns. He also highlights that “the bulls now have some momentum on their side to suggest more choppy and sideways movement at lower price levels in the short term.”
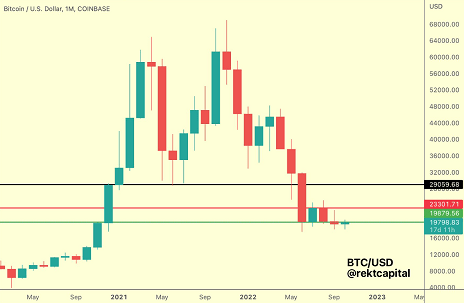
On the other hand, Rekt Capital, which provided the chart below, offered a similar view of sideways price action in the short term. The analyst noted that “BTC is still stuck below $20000, the old green macro December bottom support.” He also said that “technically speaking, if BTC fails to retrace the green as support and as a result, the $19,800-23,300 range is set for the continuation of the decline in price.”

From a historical perspective, there is no guarantee that BTC will drop significantly from this point forward. Bitcoin is currently trading near its 300-week moving average (MA). Past behavior suggests this is “one of the best spots for a long time.” As Michaël van de Poppe, CEO and founder of Eight Global puts it:
Bitcoin is holding the 300-week MA as support in previous bear cycles. 2014 tested that level, we tested 2020, and now we’re getting down to it again. One of the best points to extend Bitcoin historically.
#Bitcoin holds the 300-Week MA as support in previous bear cycles.
2014 it tested that level, 2020 we tested and now we're landing on it again.
One of the best spots to long the asset, historically. pic.twitter.com/hOHSBlvGzG
— Michaël van de Poppe (@CryptoMichNL) October 14, 2022
cryptocoin.comAs you follow, BTC is currently busy protecting the $19,000 support.


