Crypto analyst Akash Girimath says that Binance Coin (BNB) could revisit $210. According to analyst Gregor Horvat, Litecoin (LTC) continues its bearish trend in the current cycle. Analyst Filip L predicts that the leading altcoin Ethereum (ETH) will fall further as the bearish triangle remains in play. We have compiled BNB, LTC and ETH analyzes of analysts for our readers.
“Binance Coin (BNB) is in trouble”
Binance Coin price has printed three lower highs and lowest lows since Aug. But on September 28, BNB triggered a bullish break above the trendline connecting these swing points. As a result, Binance Coin is up 6%. However, it failed to retest the $301 hurdle. Eventually this failure turned into a reversal. It is possible for the ongoing downtrend to be swept below the equal lows of $257 and potentially further drop due to current market conditions.
However, the hit will be the next support level at $243. Breaking this is likely to catalyze an 11% drop to $216. A retest of this low could be a good place to hoard Binance Coins at the discounted price. Therefore, traders looking to buy Binance Coin need to be patient. Also, market participants hoping to short BNB can start hunting for entries.
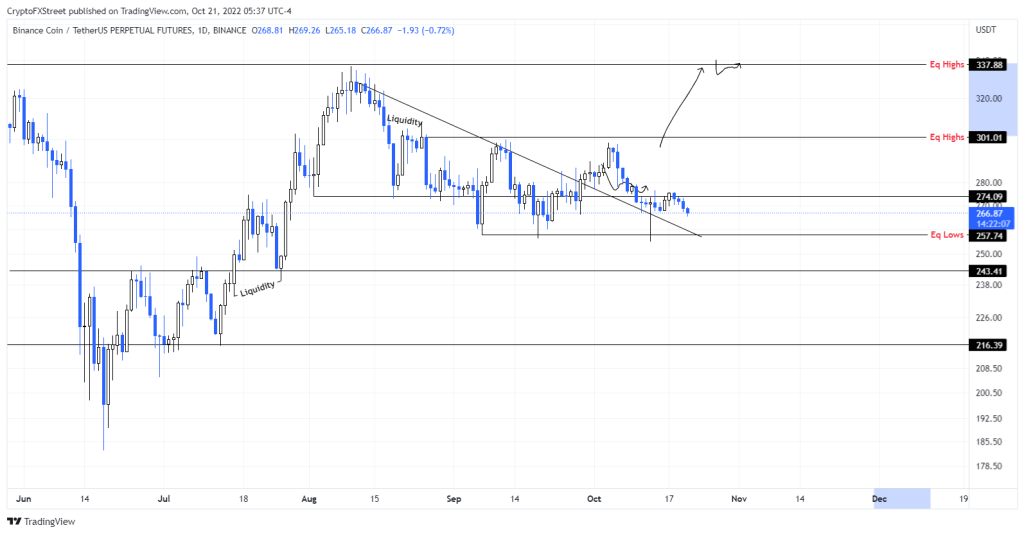 BNB1 daily chart
The fall narrative detailed above makes sense. However, BNB needs to break the $257 support level and turn it into a resistance barrier to confirm this. At the same time, a quick bounce in this barrier after a spike in selling pressure would likely trigger a sweep of the $301 hurdle. However, a daily candlestick above this level invalidates the bearish thesis. This will start an uptrend. With this development, it is possible for BNB to increase by 12%. Thus, it is likely to tag the $337 resistance level.
“Litecoin continues its downtrend”
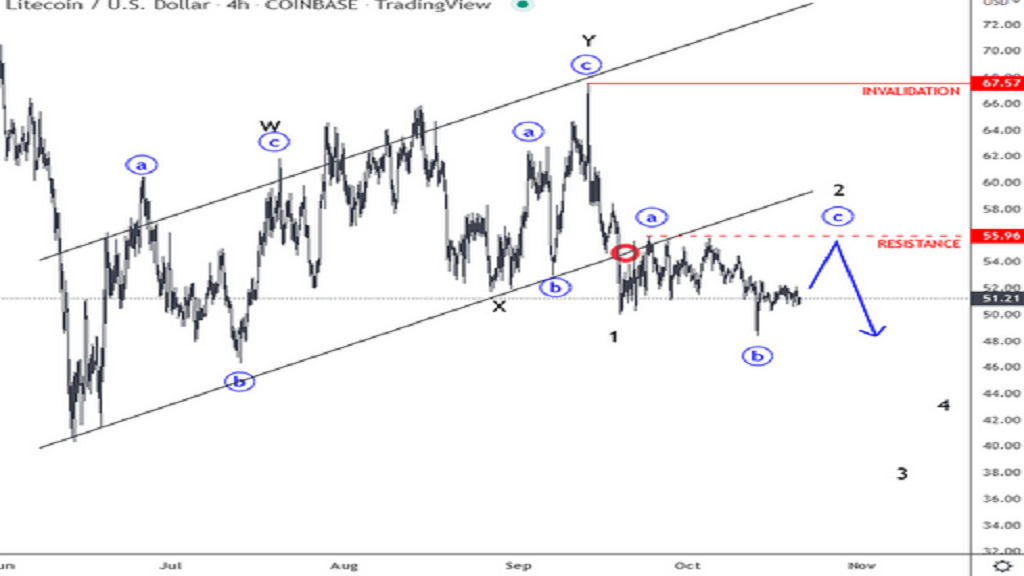
The altcoin had a complicated WXY corrective rally. After that, it drops sharply from its highs on the 4-hour chart. While the price is below the $67.57 invalidation level, it is also breaking the channel support line, which indicates further weakness towards June lows. You just have to be aware of the short-term pullbacks that are going on right now. Strong resistance is around $55-58.
cryptocoin.com As you can follow, the market has been on the decline for the last few months. However, it is approaching potential support as the price returns to the 40 zone, which is the last stages of the current cycle. However, the recent low rebound looks corrective on the intraday chart. Therefore, it has not yet confirmed a significant decline.
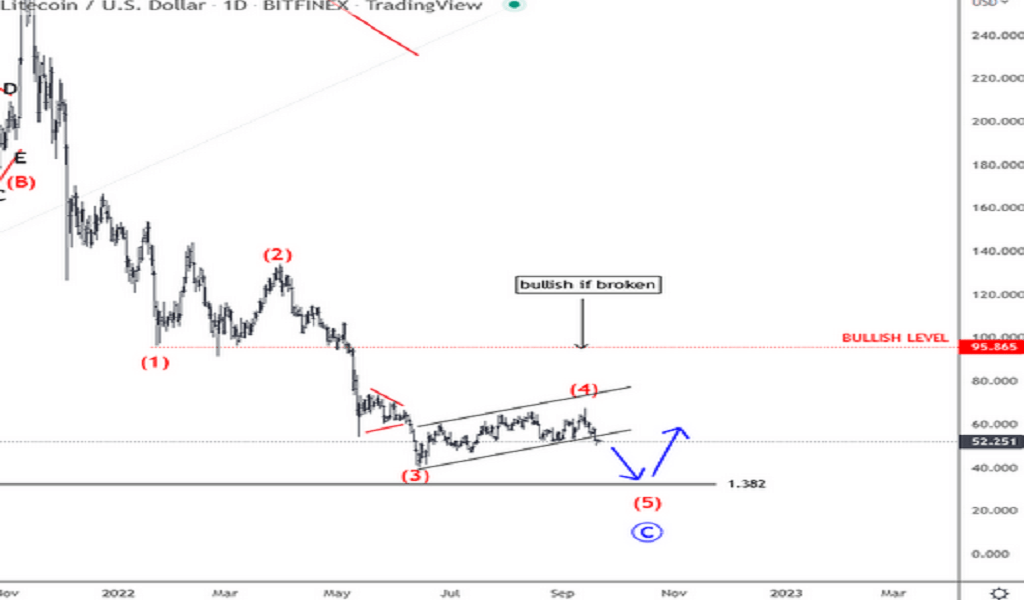
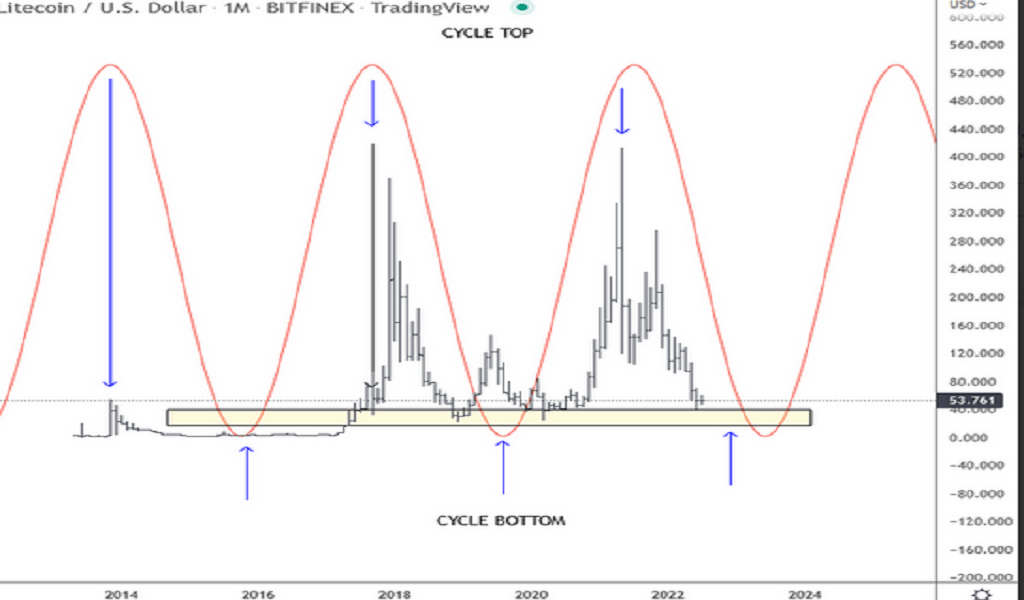
Plus, we need to cover $92.88 for the downtrend to be invalidated. Also, attention should be paid to the formation of a loop. It is now approaching the lower end point so we are likely to see a comeback in 2023.
“Ethereum sees what the bulls don’t know”
Ethereum has already dropped over 3% in the week after the bulls were outright rebuffed from the red descending trendline that continued bearish pressure on price action. He did this on October 6th. Altcoin price action fell below this on September 15. If these previous events are a reference, it means that ETH will still drop another 10% in addition to the losses already incurred. Turned into numbers, that means $1,200 is under pressure. Also, the downside is likely to continue.
ETH price is therefore still not seeing a big change in sentiment. Therefore, it remains in a downtrend. We expect more squeeze at $1,243.89, the February 1, 2021 low. When this is broken, $1,200 will attempt to capture the drop. However, it is likely to fail and lead to a breakout lower. With this move, in addition to the psychological importance of being a round figure, $1,100 comes to the fore with the monthly S1 support level as additional support.
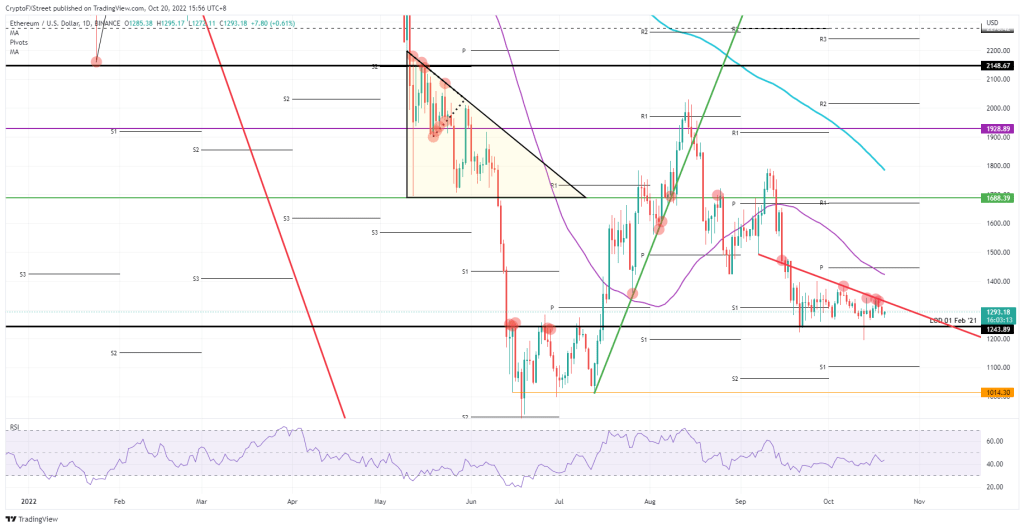 ETH daily chart
The only bullish element traders need to bounce off of is the upward break of the red descending trendline. It is possible that the warning levels around $1,338 could be extended quickly to $1,400 with a breakout move. This provides entry points for the bulls to take a break. However, the 55-day Simple Moving Average and the monthly pivot above are just inches apart. Therefore, further upside movement is likely to remain limited.