
Which altcoin or altcoins stand out for crypto traders this week? What are the levels on expectations? In this article, we tried to answer these questions.
What will altcoin BNB do?
Altcoin BNB is one of the coins that has had its share of the decline in the past weeks. However, a positive sign is that the bulls are not allowing the price to break the $220 support. This indicates lower levels of demand.
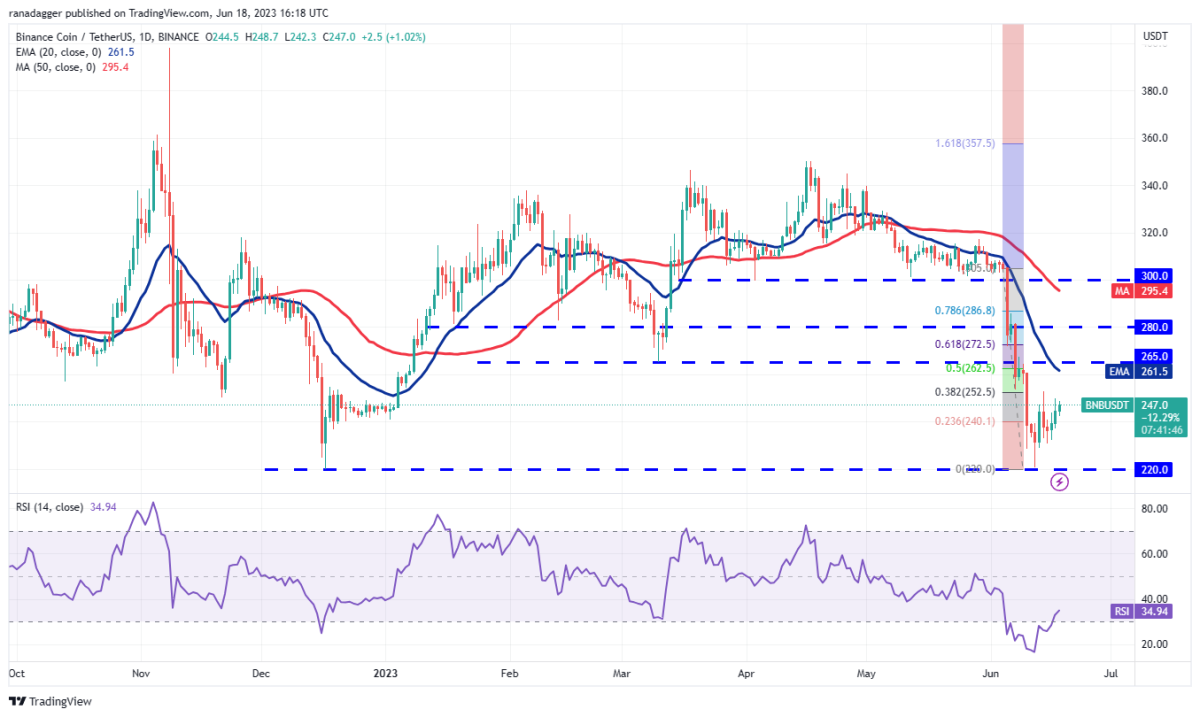
The first resistance on the upside is the 38.2% Fibonacci retracement level at $252.50. If this level scales, the BNB/USDT pair will reach the 20-day EMA ($261). The bears will try to stop the recovery at this level. If they are successful, the pair will drop towards $220. Conversely, if the bulls push the price above the 20-day EMA, the pair is likely to reach the 61.8% Fibonacci retracement level of $272.50. This is a very important level for the bears’ defense. Because if it gives way, the pair will rise towards $305.
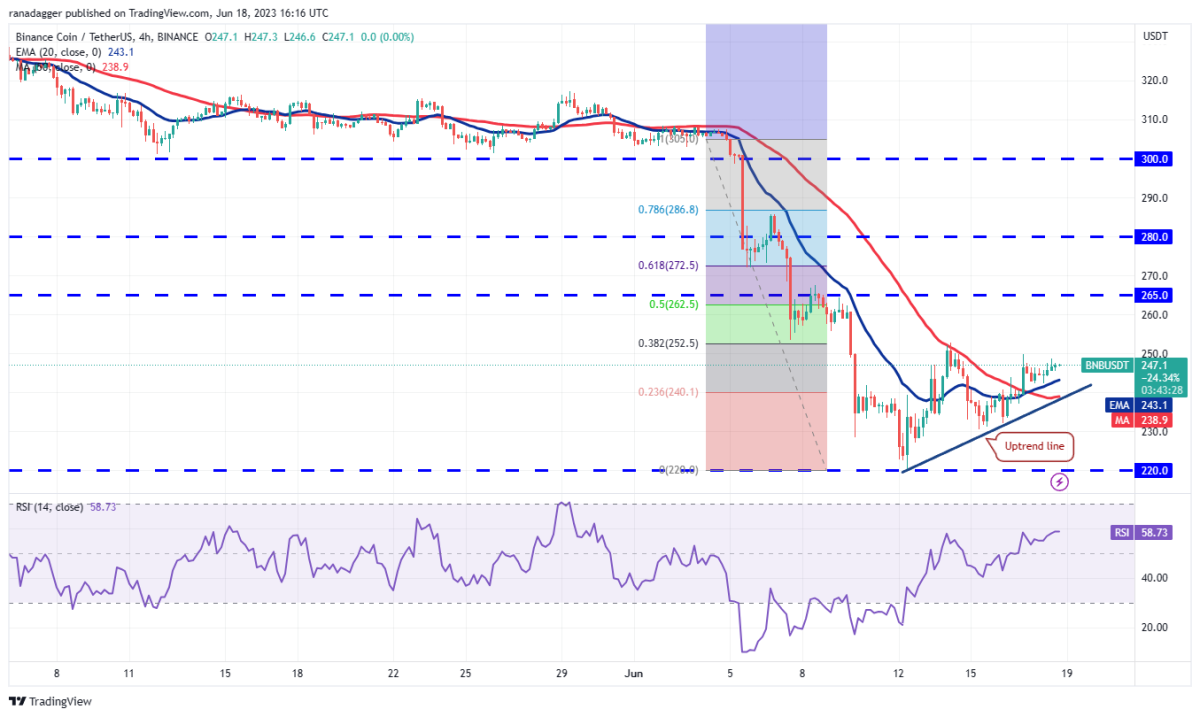
The 4-hour chart marks the moving averages completing a bullish crossover. It also shows that the RSI is rising into the positive territory. This is a sign that buyers are trying to make a comeback. The bulls will need to break the $252.50 barrier to gain strength. The pair will later rally as high as $265. On the downside, initial support is at the 20-EMA. If this level is broken down, the pair will slide to the uptrend line. A break and close below this level will indicate that the bulls have given up. The pair will later retest the critical support at $220.
For Litecoin, the bears prevail
Altcoin Litecoin fell below the symmetrical triangle formation on June 10, showing that the bears had the upper hand. Sellers pushed the price below the immediate support at $75 on June 14. But he couldn’t put anything on this move.
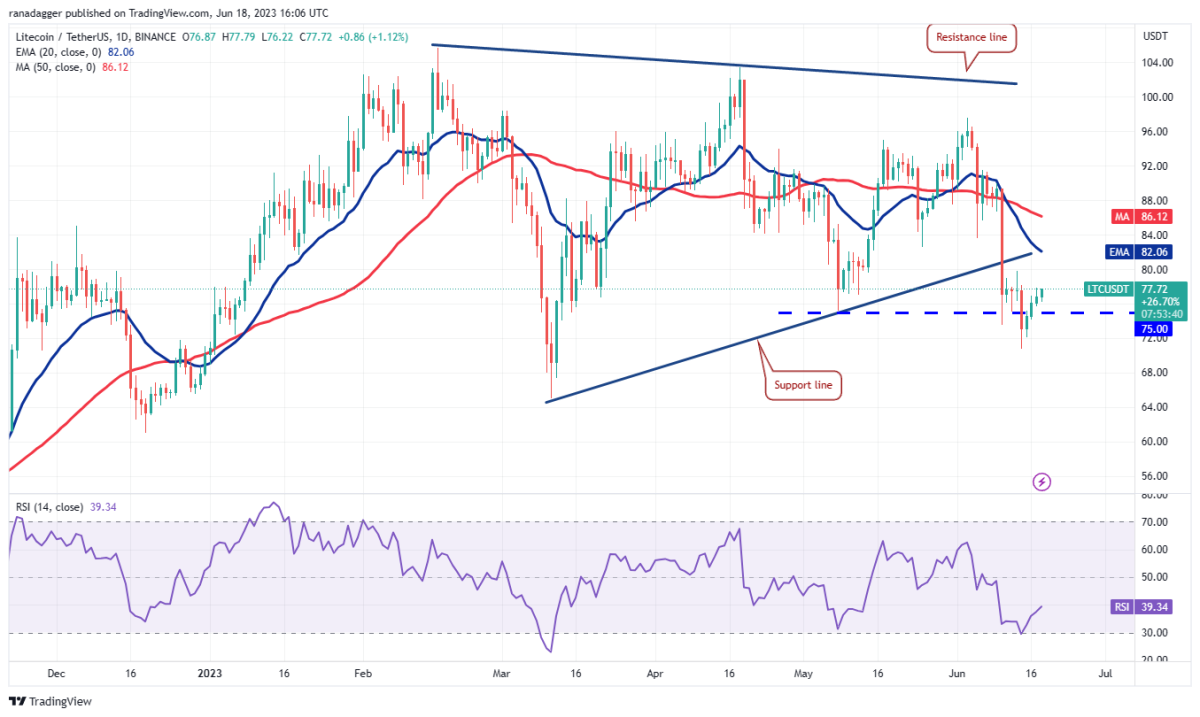
The sharp recovery in the last few days has pushed the altcoin LTC/USDT above $75. This indicates strong buying at the lower levels. The bulls will then try to push the price towards the 20-day EMA ($82). This is an important level to consider. If the buyers break this hurdle, the pair could rally to the 50-day SMA ($86). Contrary to this assumption, if the price turns below the current level or the 20-day EMA and breaks below $70, it will signal the start of a downtrend. The first stop will likely be $65 followed by $60.
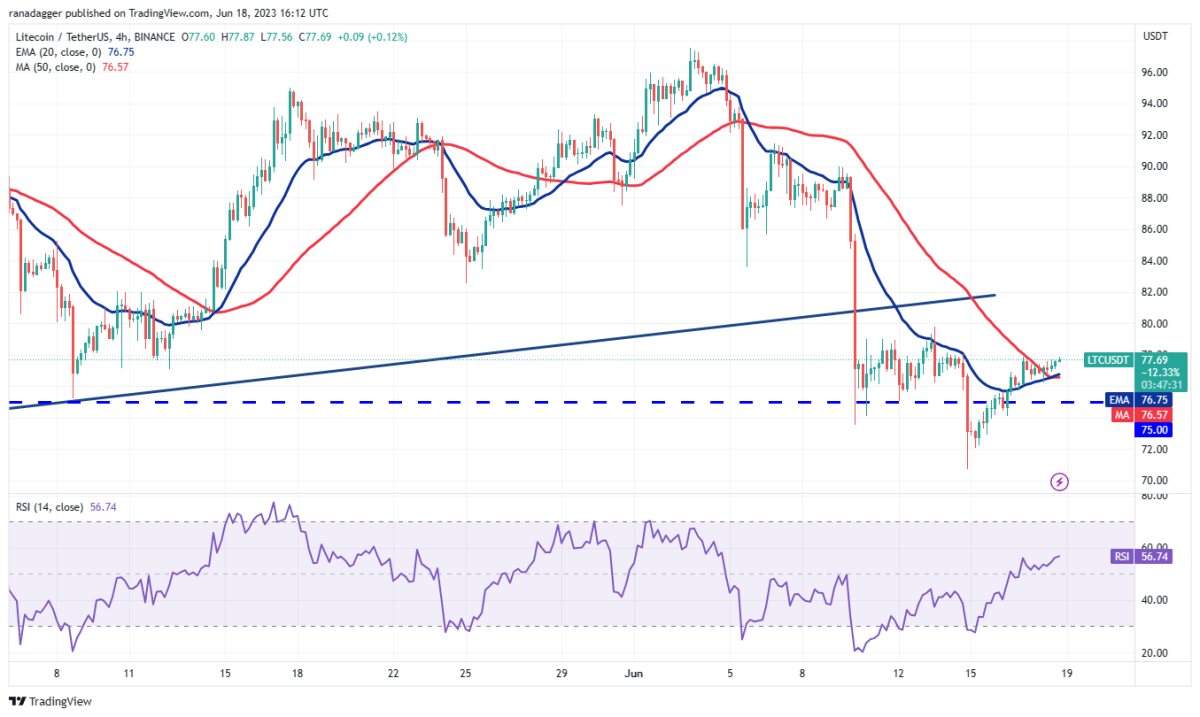
The strong recovery pushed the price above the 20-EMA on the 4-hour chart. This shows that the selling pressure is decreasing. The moving averages are on the verge of completing a bullish crossover. RSI has jumped into positive territory. This indicates that buyers are attempting to return. A minor resistance is at the $80 level. However, if the bulls break this hurdle, the pair will move up to $85 and then to $90. If the bears want to prevent the up move, they will need to quickly push the price below $75.
Altcoin OCD at the start of the correction
Altcoin OKB (OKB) broke below the symmetrical triangle formation on June 10, marking the beginning of a deeper correction. A minor positive point for the bulls is that they successfully defended the support at $30.50 and showed demand at the lower levels.
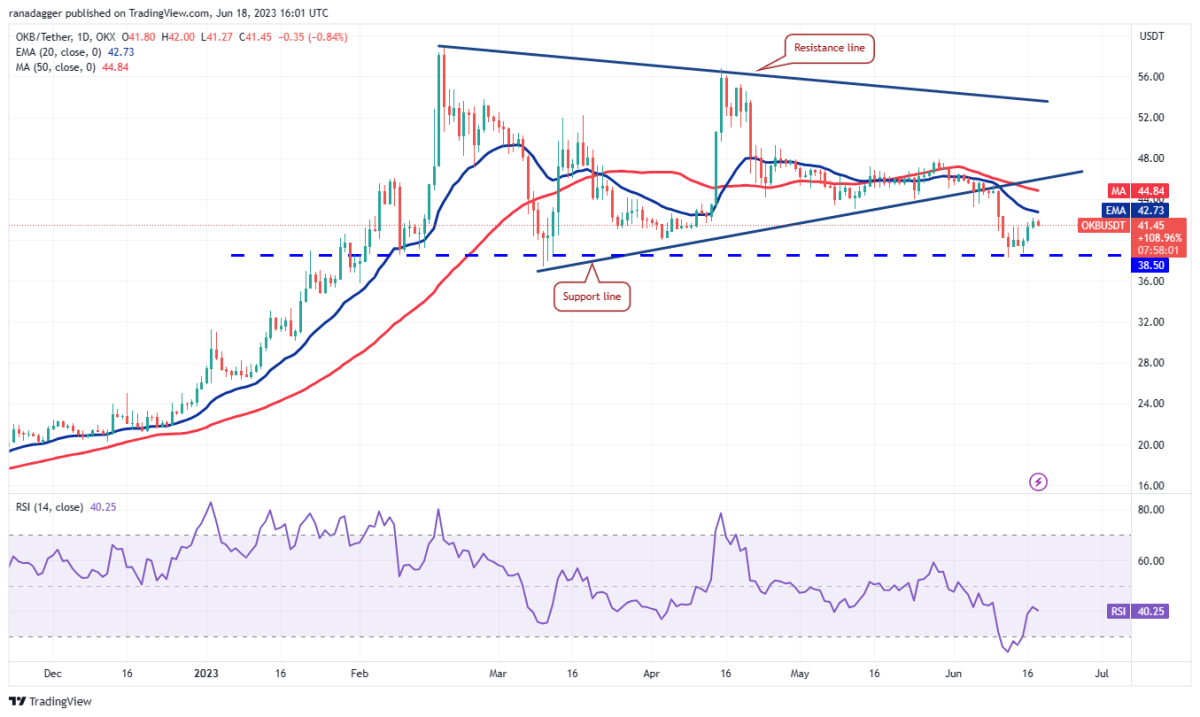
The price has reached the 20-day EMA ($42.73), an important level to watch out for. If the price turns down from the current level, it will show that sentiment remains negative and traders are selling in rallies. This could pose a serious threat to the $38.50 support. If this level falls, the altcoin OKB/USDT rate may decline to $35 and eventually to $30. On the contrary, if buyers push the price above the 20-day EMA, it will indicate that the bears may be losing control. The pair will then rise to the support line, which is likely to act as a tough resistance. Buyers will need to push the price above $48 to gain the upper hand.

The pair bounced off strongly at $38.50. However, it is facing resistance near $42.39. A minor positivity in favor of the buyers is that the moving averages have completed the bullish crossover and the RSI is in the positive territory. The pair could gain momentum if buyers push the price above $42.39. In this case, the price will come to $46, where the bears again expect a strong defense. Another possibility is for the price to decline and fall below the 20-EMA. This marks a possible range-bound action between $38.50 and $42.39 for a period of time.
Altcoin Quant gains strength
Altcoin Quant moved strongly from $95 on June 16. It also pointed to aggressive buying in support.
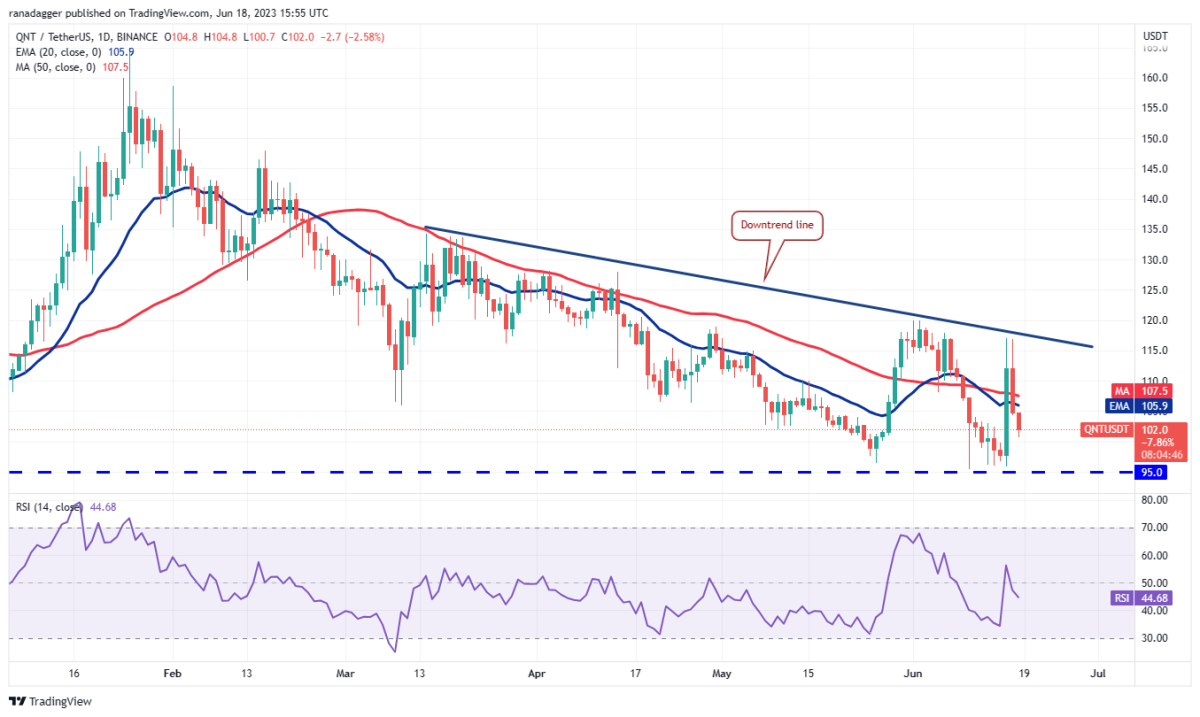
But the bears haven’t given up yet. They vigorously defend the downtrend line. Sellers are trying to push the price below $95. Also, the bulls will try to keep the altcoin QNT/USDT above this. If the price turns up from $95 once again, the probability of a rally above the downtrend line will increase. If this happens, the pair will start a strong recovery that could skyrocket the price towards $135. This positive view will be invalidated in the near term if the price continues to drop below $95. The pair could later decline to $87 and then to $80.
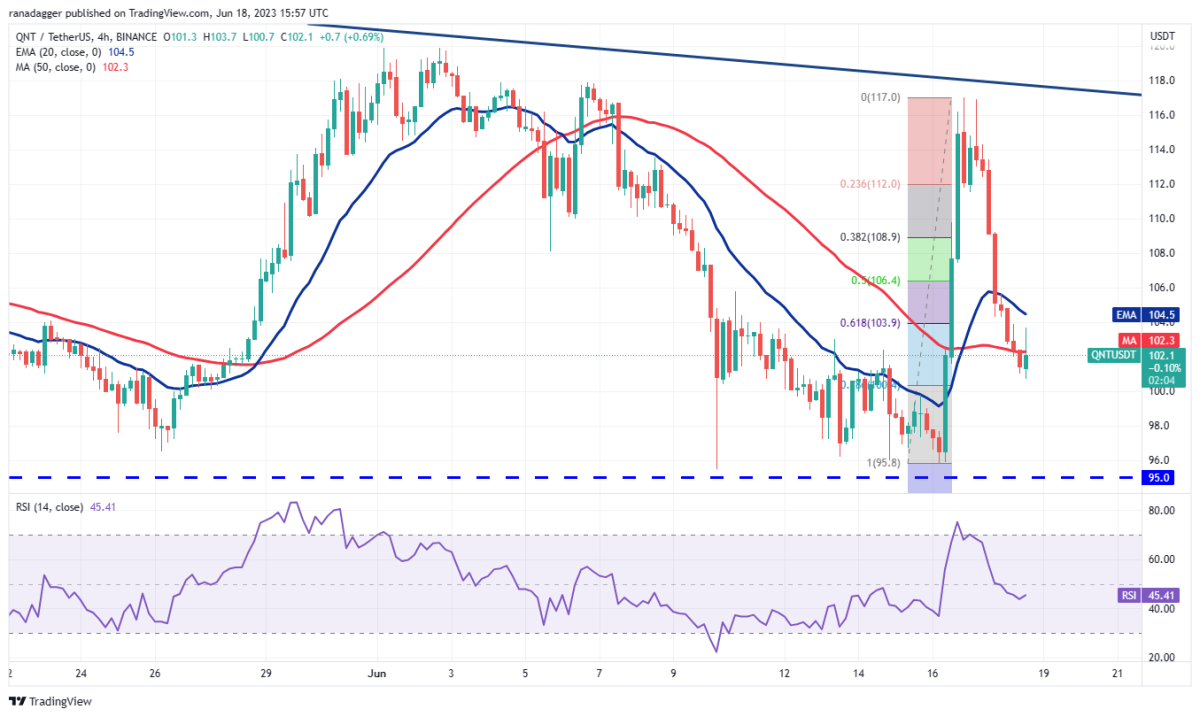
The 4-hour chart shows that the pair is quickly reversing most of its gains and bears are active at higher levels. They pulled the price below the 61.8% Fibonacci retracement level of $103.90. This is a negative sign. Buyers need to quickly push the price above the moving averages if they want to make another move along the downtrend line. Alternatively, if the price stays below the 50-SMA, the probability of a drop to $95 increases.