
Leading cryptocurrency analysts have selected the 4 best performing altcoin projects for the week ahead! So, which cryptocurrencies will attract attention this week? Here are the details…
Experts announced the altcoin projects with the most bullish potential!
Bitcoin’s volatility has decreased further this week and is on its way to forming an inside-bar formation on the weekly chart. According to experts, although the bulls are struggling to break through the general barriers in the $30,000 to $31,000 region, the bears’ lack of ground is a positive sign. Not just cryptocurrencies, even the S&P 500 Index has been trading within a range for the past few days. This indicates that the markets are waiting for a trigger to start the next direction move, according to experts.
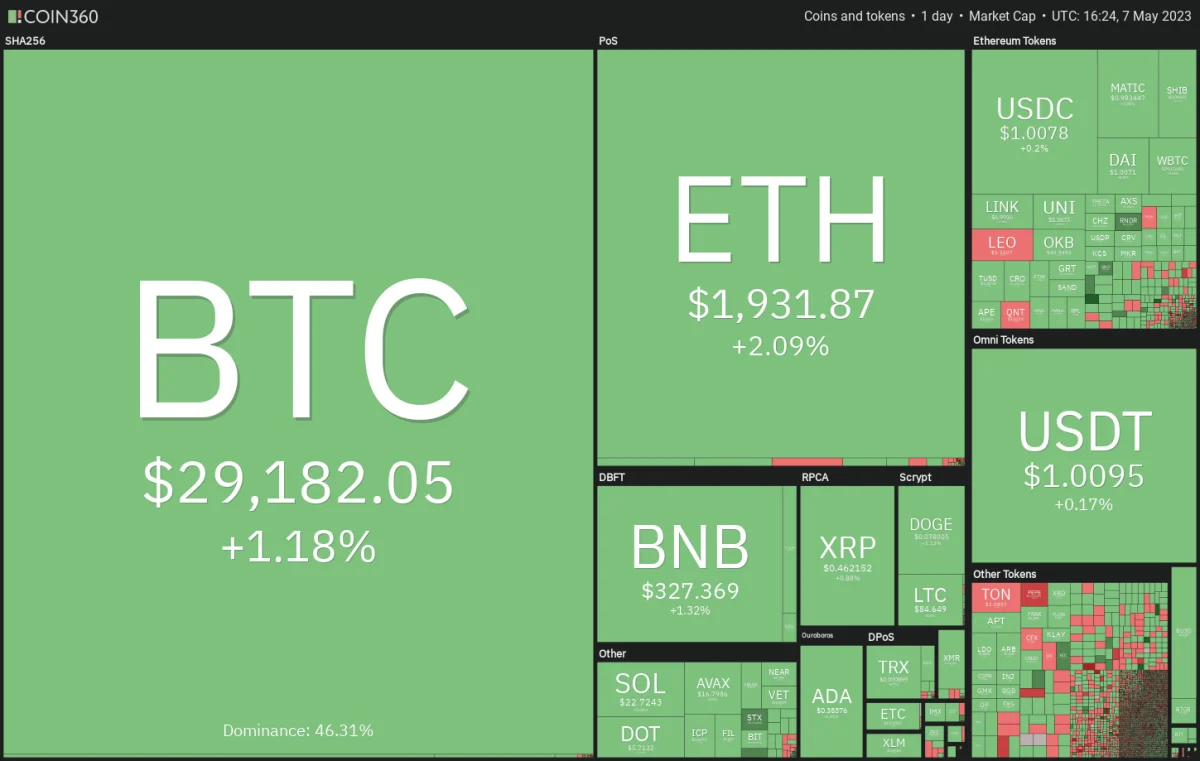 Cryptocurrency market daily price data
According to experts, although short-term price movements seem uncertain, rises are expected in the long-term. Some analysts point to Bollinger Bands and point to a potential signal on the Bollinger Bands monthly chart that predicts a rise to the $63,500 level in about a year. Although the cryptocurrency market has lost value in the past weeks, experts say that these altcoin projects may rise.
Bitcoin (BTC) price analysis
The leading cryptocurrency Bitcoin turned sharply down from the resistance line of the symmetrical triangle formation on May 6, indicating that the bears do not want to let the bulls pass. A minor positive development is that the bulls are buying dips towards the support line of the triangle as seen from the long tail on the day’s candlestick.
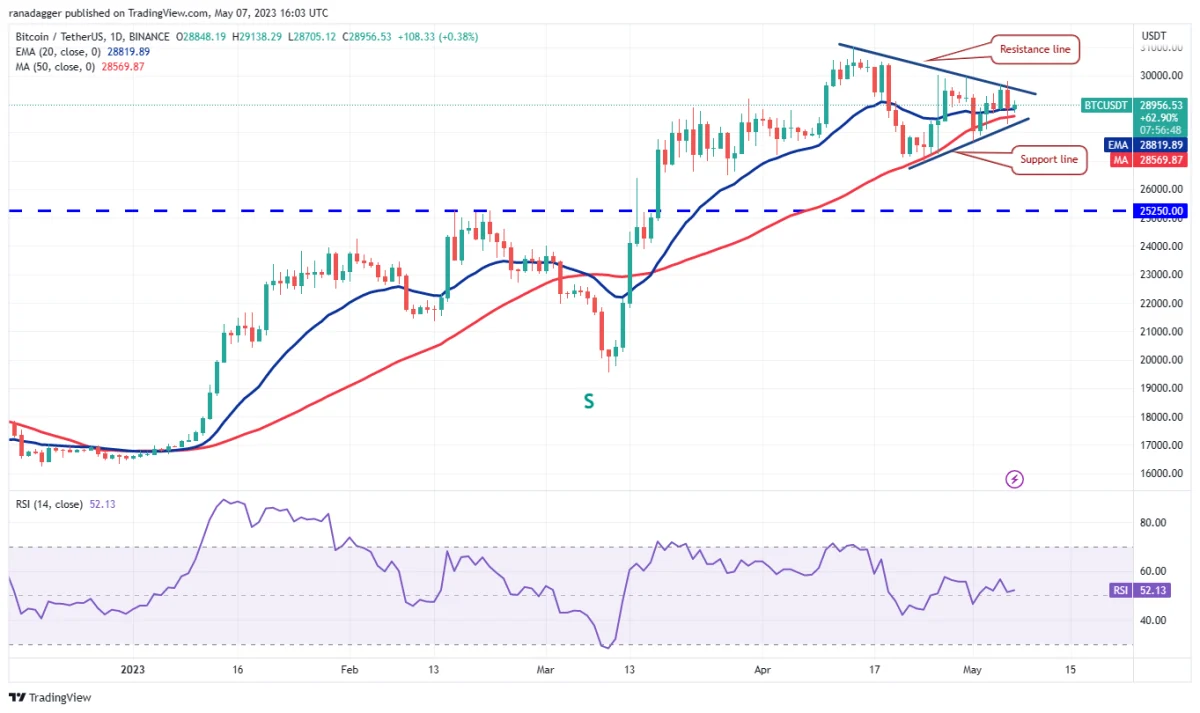 BTC daily price chart
The flat 20-day exponential moving average ($28,819) and the relative strength index (RSI) near the midpoint do not signal a clear advantage for the bulls or the bears. According to experts, a drop in the price below the triangle will indicate that the bears are trying to take control. BTC could decline to $26,942 and then to $25,250. On the other hand, a break and close above the triangle will indicate that the bulls are absorbing the supply. This could start a rally towards $32,400 where the bears are expected to put up a strong defense again.
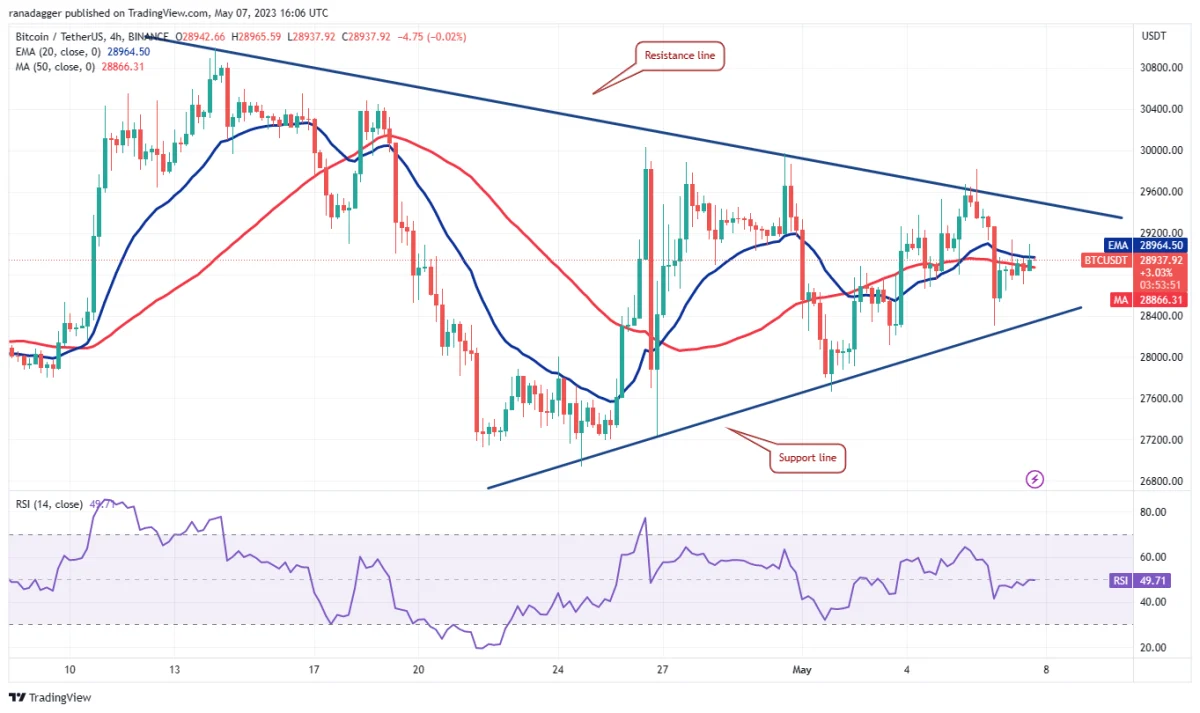 BTC 4-hour price chart
Buyers pushed BTC price above the triangle, but the long wick on the candlestick indicates that the breakout has turned into a bull trap in the near term. BTC price declined sharply and declined to the support line of the triangle.
The bounce from this level has reached the moving averages, which is an important short-term level to watch out for. According to experts, if the price of Bitcoin turns down from the current level, a break below the support line will increase the probability. Conversely, if buyers push the price above the moving averages, the pair could rally to the resistance line. The bulls will need to push and sustain the price above this level to initiate an upward move.
Ethereum (ETH) price analysis
cryptocoin.com As we reported, ETH price faced difficulties this week. Ethereum faced a strong rejection above the psychological resistance of $2,000 on May 7. This shows that the bears are not giving up and continue to maintain their overall resistance level.
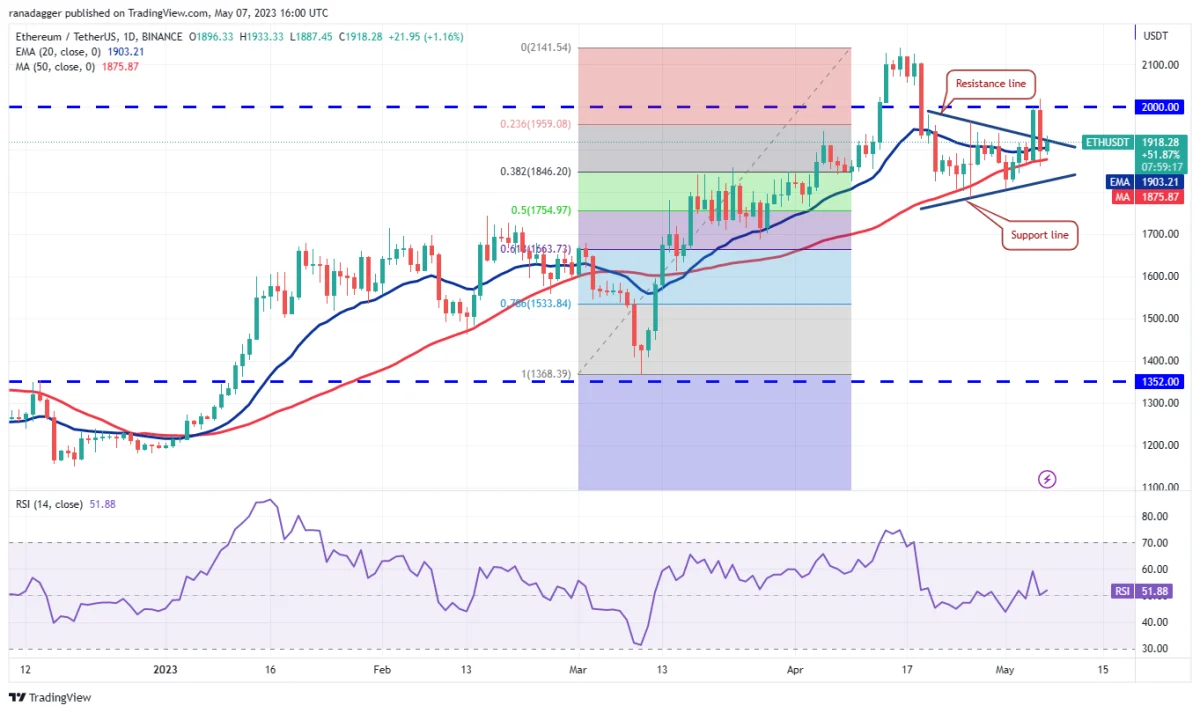 ETH daily price chart
The 20-day EMA ($1,903) has flattened out and the RSI is near the midpoint, suggesting that the ETH/USDT pair may remain range-bound in the near term. The limits of the range can be from $1,785 to $2000. A consolidation just below the local high is a positive sign. It shows that the bulls are in no rush to take profits, increasing the probability of a move above $2,200. Conversely, if the price dips below $1,785, it will indicate that the bears have taken control. This could start a decline to $1,619.
 ETH 4-hour price chart
The 4-hour chart shows that the bears failed to build on the break below the 50 simple moving average. This indicates that the selling pressure is decreasing at lower levels. The bulls are attempting a recovery by keeping the price above the 20-EMA. If they manage to do so, the pair will again attempt to retest the key $2,000 resistance. On the contrary, if ETH price drops from the current level and breaks below the 50-SMA, it will indicate that the bears are in command. This could drop the pair to the support line.
Monero (XMR) price analysis
Another altcoin on the list is described as Monero (XMR). Monero is struggling to stay above the moving averages, which indicates that the bulls are attempting a reversal.
 XMR daily price chart
The flat 20-day EMA ($156) and the RSI just above the midpoint suggest a balance between supply and demand. If buyers push the XMR price above the neckline of the inverse head and shoulders pattern, the advantage will be in their favor. The XMR/USDT pair could then start a new bullish move. A minor resistance is at $181 but if this resistance is surpassed, the pair could reach $187.
Instead, if the price of the popular altcoin XMR turns down from the current level or neckline, it will indicate that the bears remain active at higher levels. Sellers will then try to push the price below the $149 support, opening the door for a decline to $130.
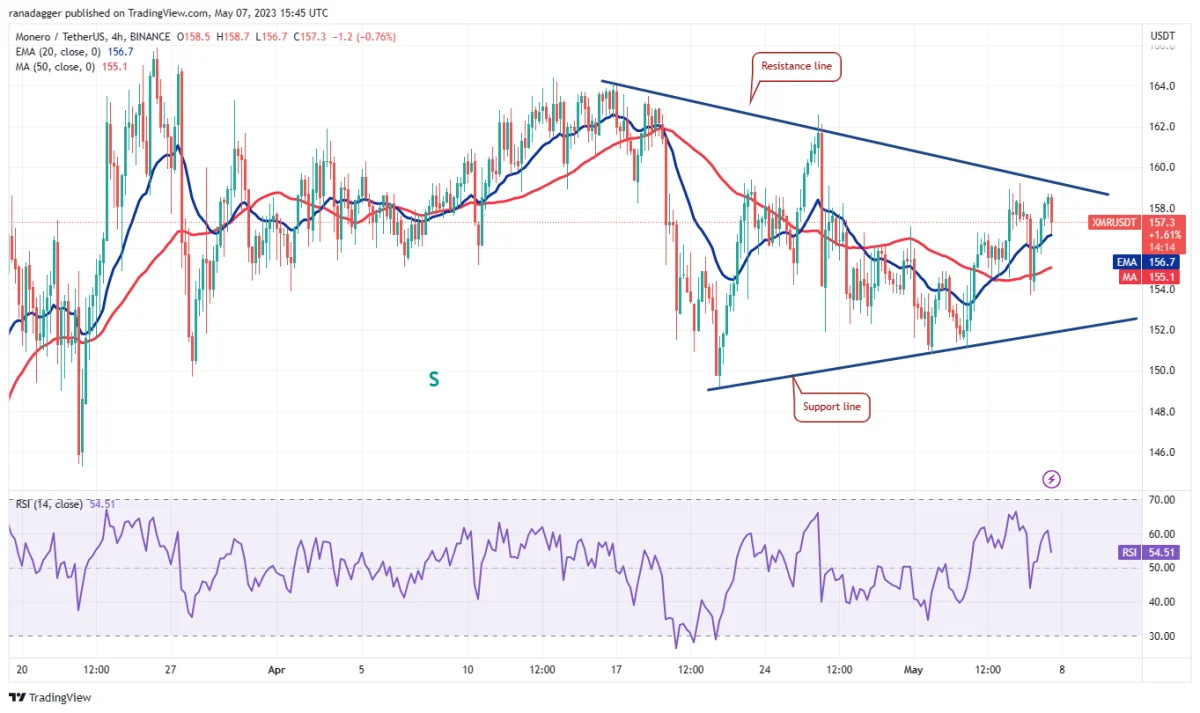 XMR 4-hour price chart
The 4-hour chart for XMR shows the price rebounding from the 50-SMA but the bulls failed to pierce the resistance line. This shows that the bears are selling in the rallies. If the price bounces back from the 20-EMA, it will indicate that sentiment has turned positive and traders are buying on the dips.
Bulls can then make another attempt to break through the overall barrier. If the bulls manage to do so, the pair could rally to $162 and then to $164, according to crypto experts. Alternatively, if the price drops and breaks below the 50-SMA, it will indicate that the bears are in control. This will increase the likelihood of a retest of the support line.
OCD (OCD) price analysis
OKB (OCD) is trading inside a large symmetrical triangle formation. According to experts, in this formation, traders generally buy near the support line and sell near the resistance.
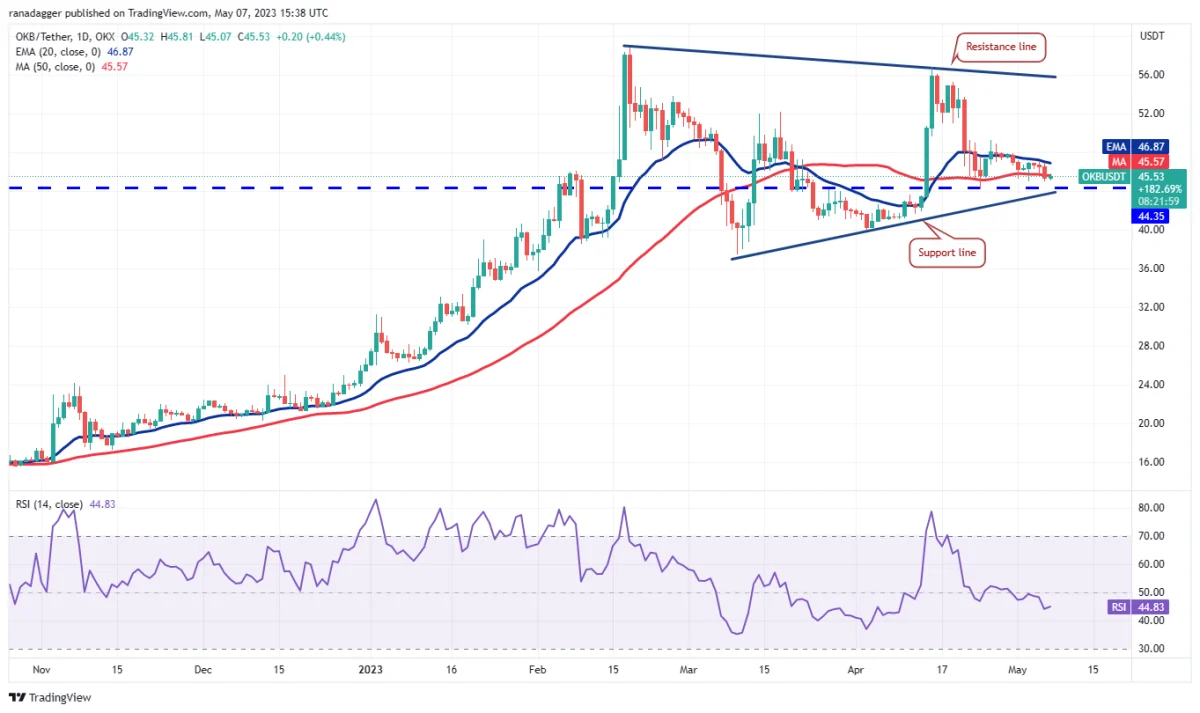 OKB daily price chart
According to experts, the bears are trying to keep the altcoin OKB price below the 50-day SMA ($45.57), while the bulls are trying to regain this level. If the price turns up from the current level or recovers from the support line, it will indicate that there is demand at lower levels.
If buyers push the price above the 20-day EMA ($46.87), it will indicate that the OKB/USDT pair may extend its stay inside the triangle for a while. Conversely, if the bears sink the price below the triangle, it could reveal that the setup is acting as a reversal pattern. This could start a new downtrend that is likely to push the pair towards $37.
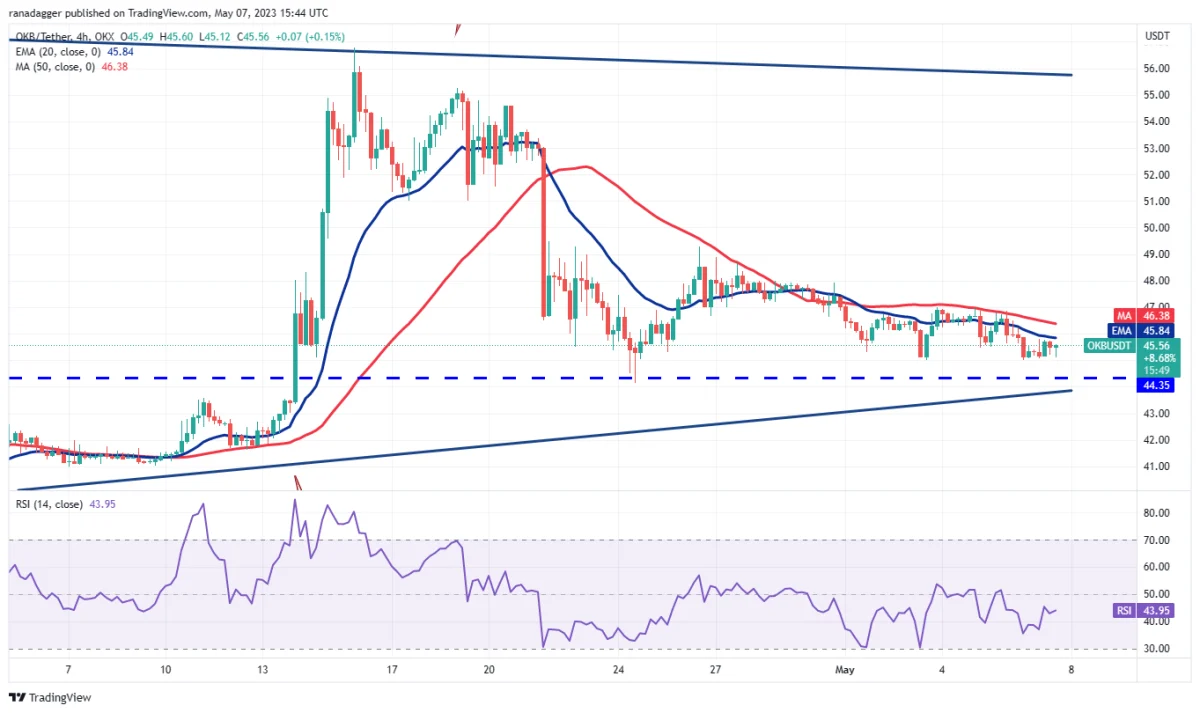 OKB 4-hour price chart
The 4-hour chart of the popular altcoin OKB shows that the bulls tried to defend the horizontal support near $44.35 but were unable to push the price above the moving averages. This shows that every little relief rally has been sold out. If the price declines from the current level and sinks below $44.35, the pair could slide as low as $41.70. Conversely, if the price rises above the moving averages, experts point to accumulation at lower levels. The pair could rise to $49.50 first and then attempt a rally to $53.
Rocket Pool (RPL) price analysis
Rocket Pool (RPL) looks strong as it is trading above the moving averages. This indicates that the bulls are buying on the lows.
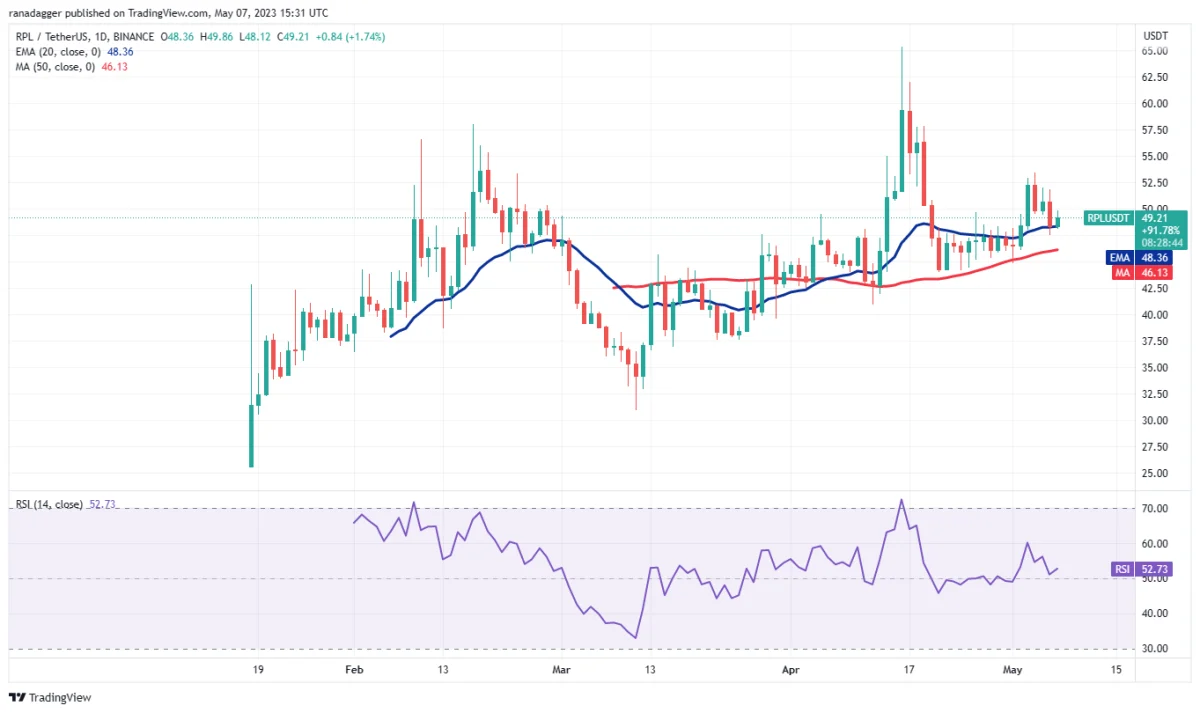 RPL daily price chart
The bulls will need to push the price above the overhead resistance of $53.45 to signal that the corrective phase may have ended. The RPL/USDT pair might try to rise to $58 after that. Another possibility is for the RPL price to rise from the 20-day EMA ($48.36) but turn down from $53.45. This will indicate possible range-bound action between the 50-day SMA ($46.13) and $53.45 for a period of time. A breakout and a close below the 50-day SMA will be the first indication that the bears are in command. This will open the doors for a potential drop to $37.
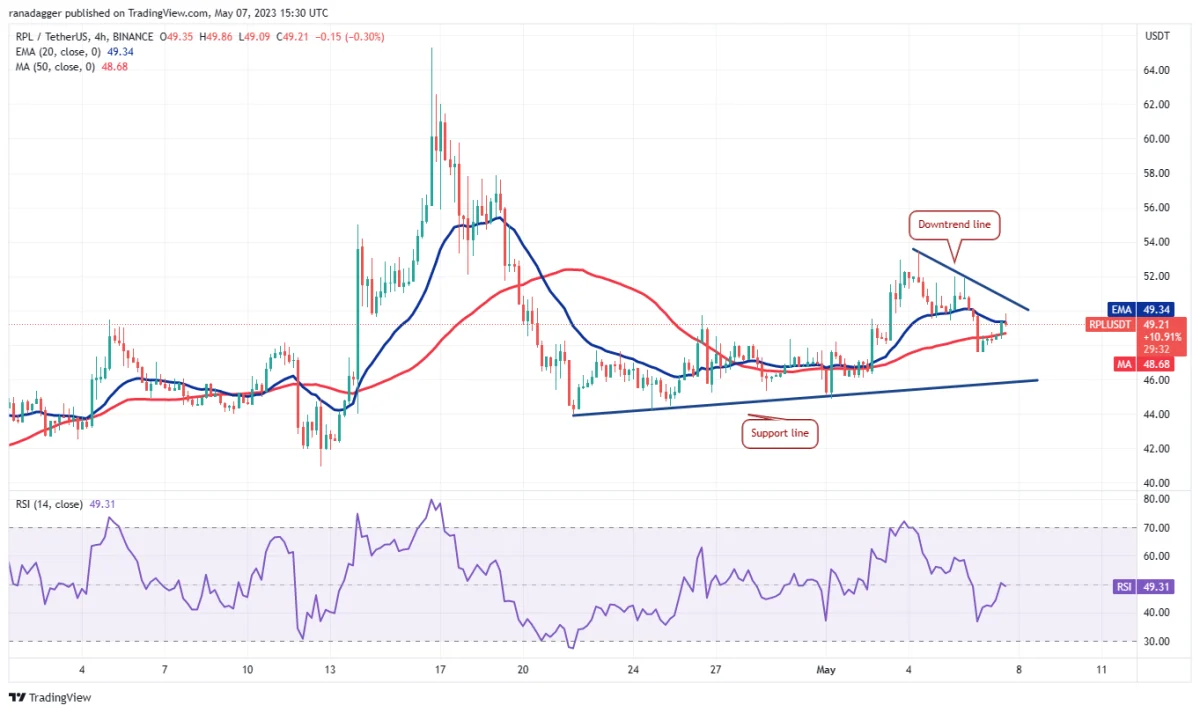 RPL 4-hour price chart
According to experts, the 4-hour chart for the popular altcoin RPL shows that the bears are trying to keep the price below the 20-EMA, while the bulls are trying to push the price above it. If the buyers are successful, the pair could rally to the downtrend line. This is the key short-term level to watch. If this resistance is surpassed, the pair could rally as high as $53.45. On the contrary, if the price turns down from the current level and breaks below the 50-SMA, the price risks falling to the support line. According to experts, it seems likely that the bulls will vigorously defend this level.