Fear has hit the cryptocurrency market after Bitcoin slumped to $20,800 today. Now, several technical and on-chain metrics suggest that BTC may be nearing the bottom. Also, an economist is trying to predict the end of the bear market.
“Bitcoin shows early signs of bottoming”
Bitcoin has reached a vital support zone, which could lead to a trend reversal. As you follow onKriptokoin.com , BTC has seen its price drop by around 70% in the last seven months. In mid-November 2021, it was trading at the ATH level of $69,200. However, it recently hit a new year low of $20,800.
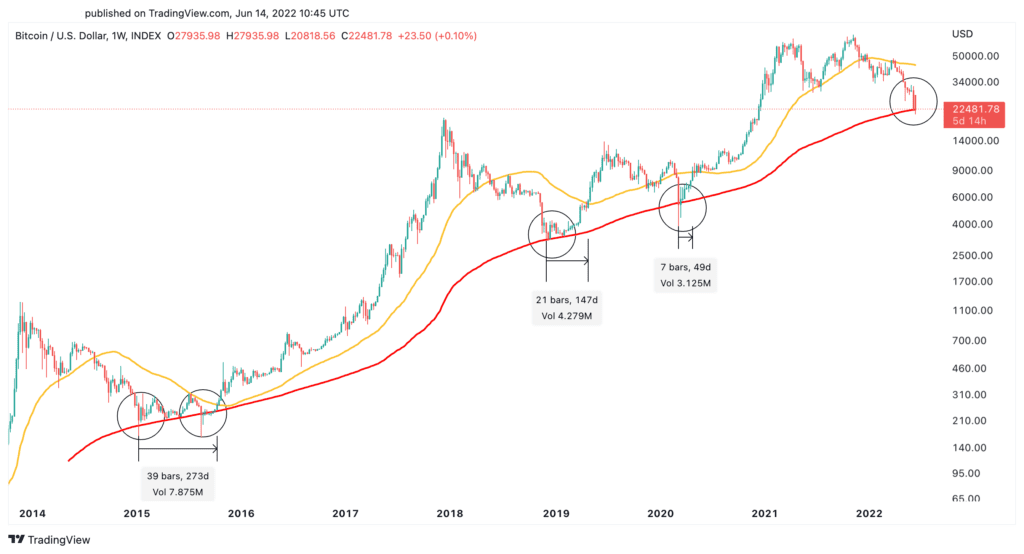
Considering the uncertainty in the global financial markets, the macroeconomic environment is in a downward trend. However, analysts think that BTC is approaching a market base. The 200-week moving average has served as the last line of defense in previous bear markets.
Since 2015, every time Bitcoin has returned to this critical support level, prices have started to consolidate. It then formed a market floor before a new bullish cycle began. BTC is currently close to its 200-week moving average, which could be the first sign that the trend is about to reverse.

BTC one-week chart / Source: TradingView
What does the Entity-Adjusted Dormancy Flow show for BTC?
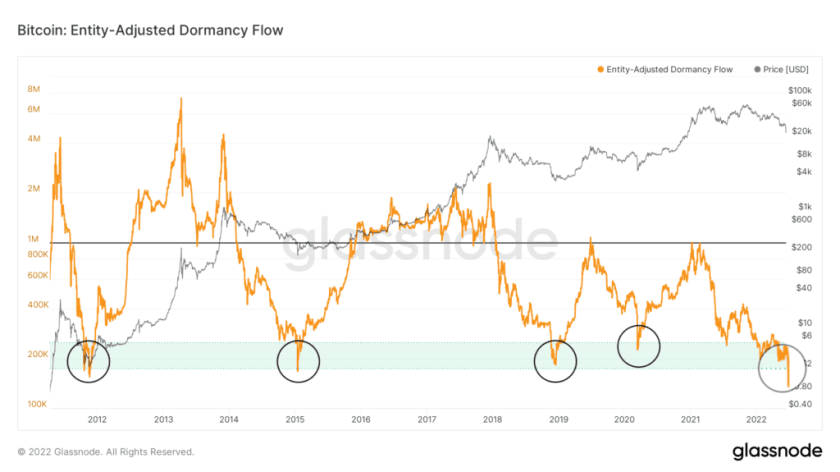
Bitcoin’s Entity-Adjusted Dormancy Flow suggests that it is likely that BTC will form a market floor. The indicator takes into account the ratio of current market cap to annual dormant value to determine whether experienced market participants are spending their BTC.
This on-chain metric has timed every market dip almost perfectly since 2011. When there is a significant drop in spending from long-term holders or ‘old hands’, the metric drops below the 250,000 threshold. And according to analysts, it represents an excellent historical buying zone.
 Bitcoin’s Entity-Adjusted Dormancy Flow / Source: Glassnode
 Entity-Adjusted Dormancy Flow is currently sitting at an all-time low of 149,150. Hence, it is likely to mark the end of the current downtrend.
‘Hope’ in market sentiment for Bitcoin?
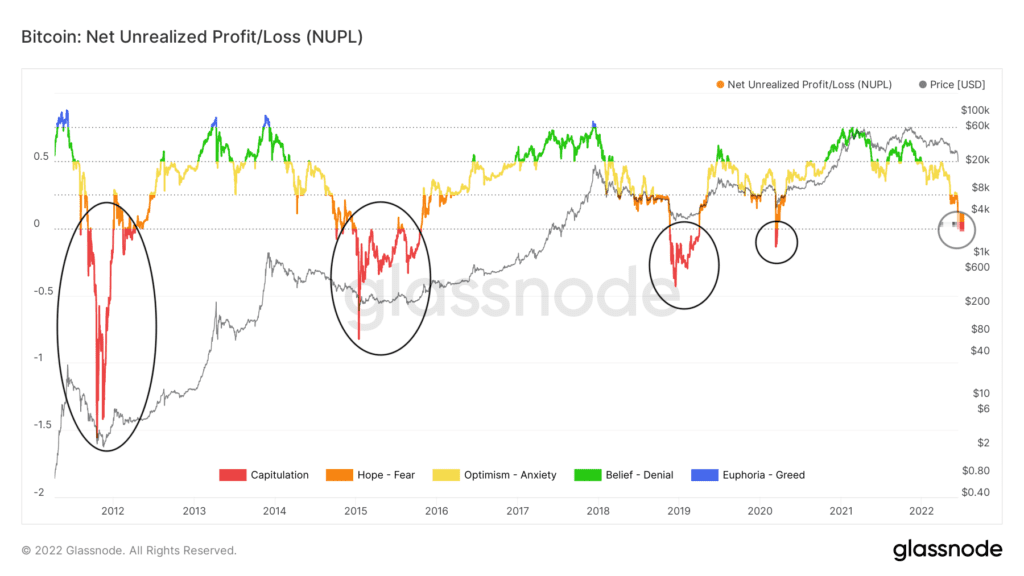
The Net Unrealized Profit/Loss (NUPL) indicator predicts changes in market sentiment. It also works well when predicting the highs and lows of the market. It relies on multiple on-chain data points to show the emotions of potential investors at a given time. This, in turn, helps determine price movements.
Market sentiment around Bitcoin seems to have shifted from “Fear” to “Capitulation” after prices dropped to $20,800. This represents the final phase of the bearish cycle before market sentiment turns into “Hope” to signal the start of a new bull market.
 Bitcoin’s Net Unrealized Profit/Loss / Source: Glassnode
 Analysts look at Logarithmic Regression Lines for Bitcoin
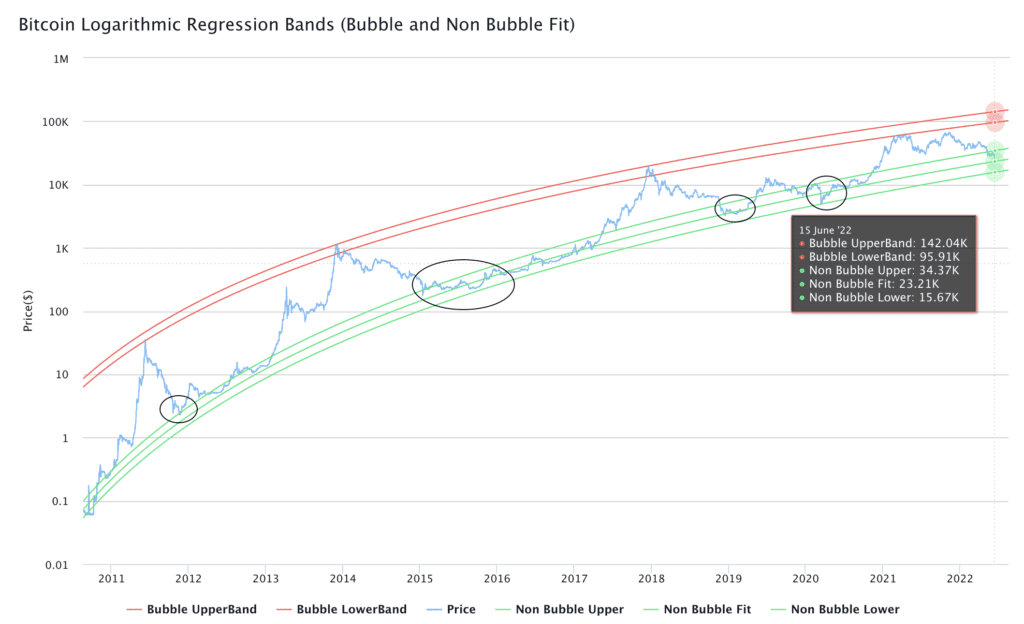
Evaluating the metric analysts draw the following conclusions. Technical data and on-chain indicators show multiple signs of a market bottom. However, there may still be room for Bitcoin to drop further before a recovery begins. Logarithmic Regression Lines describe two key price levels at which Bitcoin can bottom out. The non-bubble fit regression band is $23,210. The non-bubble subregression band is hovering at $ 15,670.
Bitcoin is currently trading between the non-bubble fit regression band and the non-bubble subregression band. This is a signal that marks the bottom of the market in previous downtrends. It is possible for prices to fall into the non-bubble lower regression band as in March 2020. However, this indicator shows that BTC could present a unique opportunity for marginal investors to re-enter the market.
 Bitcoin Logarithmic Regression Bands / Source: IntoTheCryptoVerse
 It is unclear whether Bitcoin entered a period of consolidation before entering a new uptrend. It is also not yet known whether it will see another correction towards $15,670 first. Regardless, the risk-reward ratio looks positive for those looking for a chance to time the market bottom.
The bottom may be near, but the recession may still take 18 months
Economist Raoul Pal shows the most attractive opportunities of the ongoing market situation. Pal doesn’t seem surprised by the continued decline in cryptocurrency prices. According to him, a decline of more than 60% over a 5-10 year time horizon is common.
Leverage is your enemy in a volatile asset. I never use leverage in crypto. Waves of margin calls are hitting those silly enough to use it and that is forcing the markets lower and causing more margin calls…
This is not just a crypto thing. All collateral is being liquidated.
— Raoul Pal (@RaoulGMI) June 14, 2022
Therefore, I recommend looking at the five-year Exponential Moving Average . Bitcoin (BTC) price normally stays below this critical level for no more than 30 days. On the other hand, BTC still has a significant drawback. Pal expects the macroeconomic situation to return to normal within 12-18 months.
At the same time, Raoul Pal’s divergence log regression model, RSI metric and DeMark weekly charts indicator suggest we have entered the ‘buy’ zone and the bottom may be near. For Pal, the market opens up incredible opportunities for long-term portfolio management. Pali says:
I am preparing to add significantly to my crypto positions. Probably next week and by July.


