Bitcoin (BTC) price regains the support of the bulls in the week of April 24, when it started with a decline. After being in the red for 3 consecutive days, the price has given the green light technically today. Despite the positive momentum, senior market analysts disagree about a clear rally.
Bitcoin hash rate warns of new lows
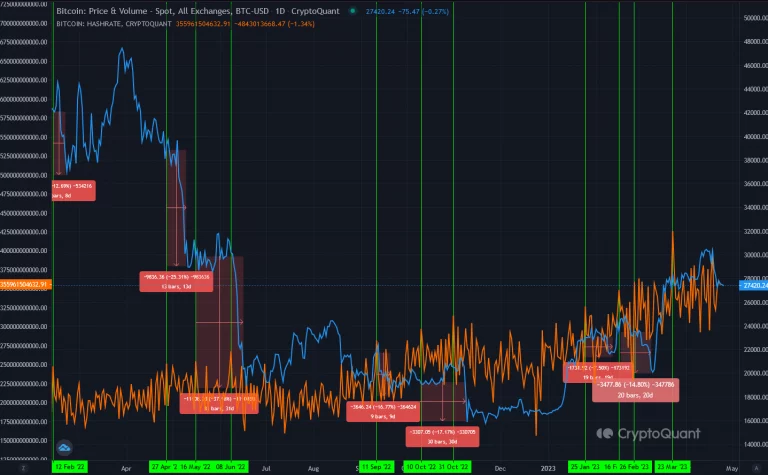
According to CryptoQuant data, Bitcoin hit an all-time high in hash rate on March 23. While the new peak is lasting longer than usual, this increase matches all previous cases. For those who follow this metric closely, a continuation of a 10% increase is usually followed by at least a 7% drop in Bitcoin price as the hashrate reaches the new ATH.
Based on this analysis, in the current scenario, the price of BTC could potentially drop to at least 25k. Also, if we take into account the minimum and average price decline in the past, the probability of approaching 23 thousand is also on the table. In previous cases, it took about a month for this trend to emerge.
What does technical analysis say about BTC?
Historical analysis of the hash rate has shown that after peaking it often triggers a drop for BTC. On the other hand, BTC price is giving green signals from a technical point of view. The shift in indicators came after the leading crypto was in the red for three consecutive days. A few technical things are important here:
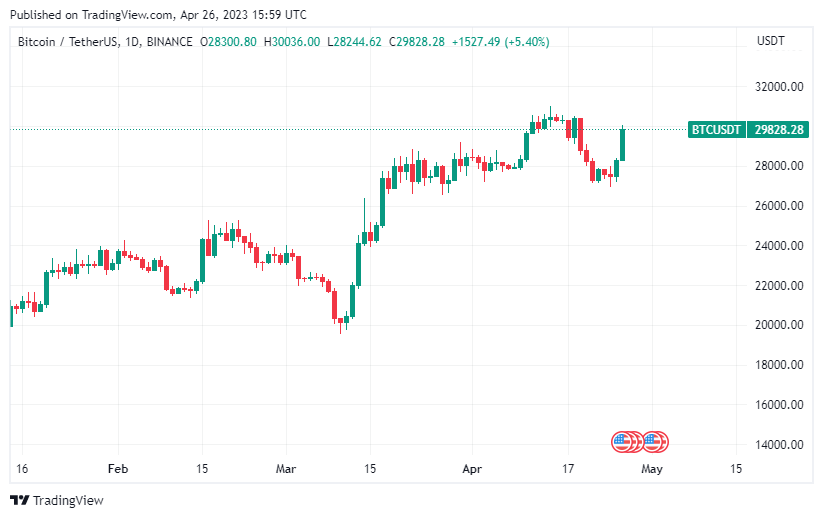
- $30,000 is clearly showing resistance on the BTC chart. Support or resistance for Bitcoin and ETH tends to be concentrated around large integers. This is because traders usually place buy and sell orders at points ending in 0 or 5.
- Bitcoin reached $30,000 in line with the upper range of the Bollinger Bands at the time.
- Bitcoin’s trading range has narrowed by as much as 0.0005% between opening and closing as it reaches the upper range. Nu also implies that buyers and sellers are satisfied with its price.
Bitcoin Bollinger Bands analysis
Bollinger Bands plots a coin’s 20-day moving average and calculates two standard deviations above and below the average. In the BTC case, the breach occurred, possibly in connection with a psychological resistance point.
The recent drop is accompanied by an expected drop in momentum. But it also coincided with a move towards the lower end of the Bollinger Band. The momentum drop is seen in BTC’s RSI data drop from 71.54 to the current 42.53.
Matrixport analysts set this level for BTC’s 2023 peak
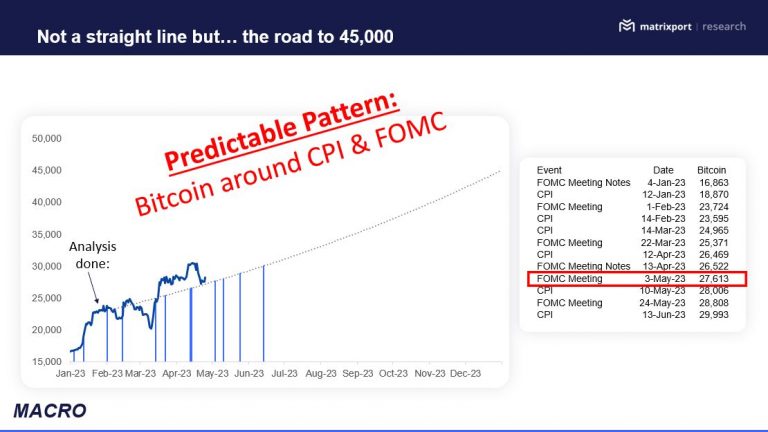
Matrixport principal investigator Markus Thielen recently predicted that the price of Bitcoin will reach around $45,000 by the end of this year, in a statement on LinkedIn.
Thielen’s forecast is based on his belief that inflation will be a big tailwind for risky assets, especially Bitcoin. He also states that the US 10-year bond yield trading below 3.50% is an indication of this. According to Thielen, the CPI/FOMC roadmap laid out in early February shows that despite the recent surge, Bitcoin prices are exactly where they should be.
Key highlights from Thielen’s report are as follows:
- According to the CPI/FOMC roadmap announced in February, Bitcoin prices are where they should be.
- According to the January Effect, Bitcoin prices could end the year around $45,000, which is now a pretty achievable figure.
- It is recommended to sell when prices are +10% above fair value or to buy when -10% below fair value.
- Additional purchase at $27,500.
- Even if discounts are preferred, it makes sense to buy $27,000/27,500 at “fair value”.
- US 10-year bond yield trading below 3.50% suggests inflation will be a big headwind for risky assets, especially Bitcoin.
- The volatility index (VIX) trading below 20 will push the market higher for a slow summer crush, as Bitcoin outperforms stocks due to its sensitivity to liquidity.
- Bitcoin is currently neither overvalued nor undervalued. Additionally, the Greed and Fear indices do not signal any over-reading.
- Patience and discipline are the keys to sticking to data and analysis. The road to $45,000 continues.
TechDev says historical data signals bullish
TechDev, a popular crypto analyst, says multiple technical indicators are showing that they can mimic the 2015 bull market, a cycle in which Bitcoin surged from under $200 to $20,000 in about two years. The crypto analyst shares two charts showing how BTC has followed the 2015 cycle over the past year and a half.
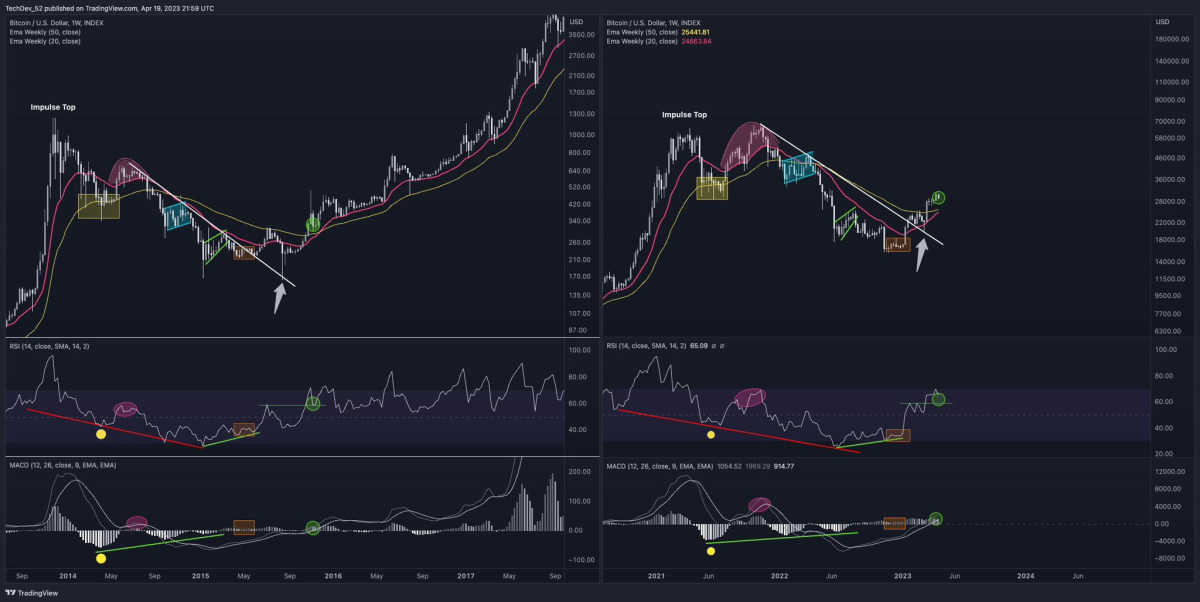
The look on TechDev’s chart shows BTC removing a bearish crossover resistance in 2022. Also, it seems that the leading crypto is retesting this level as support. This structure is strikingly similar to BTC’s price action in 2014 and early 2015.
The analyst’s charts also show similarities in the movements of the two technical indicators. The first is the RSI, a momentum indicator. The second is the moving average convergence divergence (MACD), a trend following indicator.
BTC estimate of $130,000 from Credible
TechDev isn’t the only analyst to believe that BTC could deliver exponential gains in the coming months. Credible, which you follow on Kriptokoin.com, predicted that BTC will reach $130,000 before the end of the year.