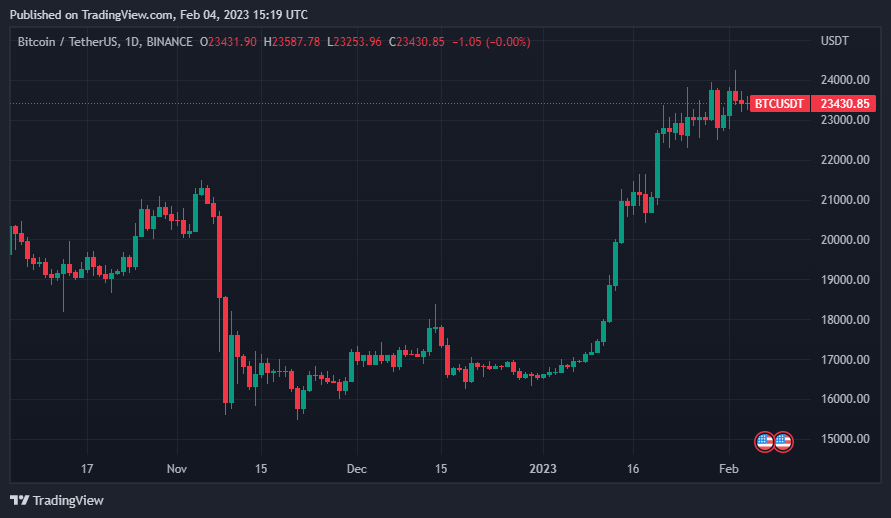
Bitcoin rally stalled at $23,400 as investors digested better-than-expected employment data. Analysts predict the next steps of the BTC rally, accompanied by a potential golden cross…
Experts say indicators give the green light for Bitcoin
According to senior technical analyst Jim Wyckoff, “BTC bulls still have a solid overall short-term technical advantage.” The analyst also says that the price uptrend continues firmly on the daily chart. Wyckoff noted that this advantage means that “the bulls have the power to push prices up in the short-term.”
Elsewhere, in MatrixPort’s latest “Matrix on Target” newsletter, head of research Markus Thielen pointed out that the Bitcoin halving of March 2024 is the potential driver for a bull market in 2023, as previous halvings “crypto It was very bullish for its prices. According to Thielen, “There is a high statistical probability that Bitcoin could double from here to now. This momentum could bring Bitcoin to $45,000 by the end of the year.

For tech chart lovers, Benjamin Cowen, founder of the Into the Cryptoverse newsletter, posted the tweet below, which features a chart of previous Bitcoin cycles and shows that BTC still has a long way to go before it can top out.
#Bitcoin cycles as measured peak-to-peak
2013-2017 (red)
2017-2021 (orange)
2021-present (green) pic.twitter.com/KzfrogQhZd— Benjamin Cowen (@intocryptoverse) February 3, 2023
“$23,400 is very important”
In the short term, another popular Twitter analyst, Rekt Capital, said, “It is crucial for BTC to hold $23,400 as support because when BTC retested it in August 2022, it succeeded and fell back into the blue-to-blue range.” According to Rekt Capital, a “key retest” is currently underway.
Bitcoin prepares for golden cross
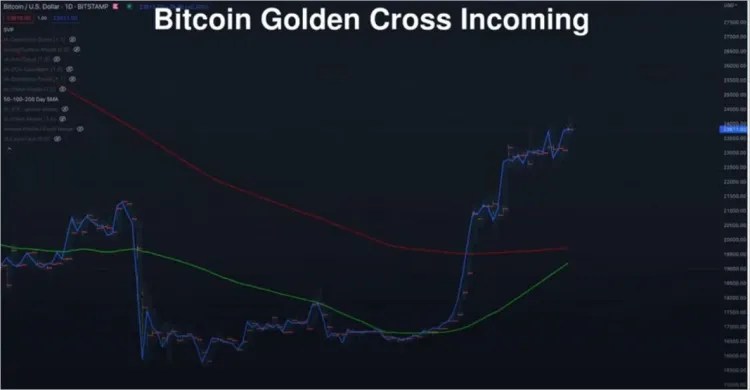
The Bitcoin golden cross, hosted by Youtube channel InvestAnswers, could lead to explosive price movements to the upside in the short term. The crypto analyst mentions that Bitcoin may rally between the potential intersection of the two key indicators. A golden cross occurs when the short-term moving average (MA) crosses above the long-term moving average. According to the text in InvestAnswers’ latest video:
Looking at the golden cross, we’ll probably see it in about six days, maybe a little less, depending on the trajectory of Bitcoin’s movement. A golden cross occurs when the green line, the 50-day moving average, crosses the red line, the 200-day moving average. In the past, Bitcoin’s big rallies, big, big rallies, started with the golden cross.

The analyst then warns that the odds of the golden cross failing are at least 20% down:
Note that not all golden crosses lead to a great rally. I think it’s only about 72% – 80%. However, Bitcoin saw eight golden crosses, three of which were later confirmed major moves. February 2012, October 2015, and May 2020. All of these were currently at a pre-bull run staging point of at least a year to 18 months and prices have at least doubled or increased 350% or much more.
The golden crosses of July 2014, 2015, and February 2020 were bull traps, and Bitcoin then went downhill.
What levels does the golden cross point to in a bullish situation?
According to the host of InvestAnswers, there is a 50% chance of a Bitcoin gaining upward momentum after the golden cross. On the prospect of following the upcoming golden cross with a rally, the crypto analyst says, “There’s a good chance maybe, more than 50%, I’d say it’s at least a 60%, 65% shot.” cryptocoin.comAs you follow, BTC is currently trading slightly lower below $23,500.


