After BTC fell to 2017 highs, 6 crypto analysts evaluated Bitcoin (BTC) price action. Accordingly, experts say that the entire crypto market has entered a very long period of consolidation and accumulation.
How is the Bitcoin price?
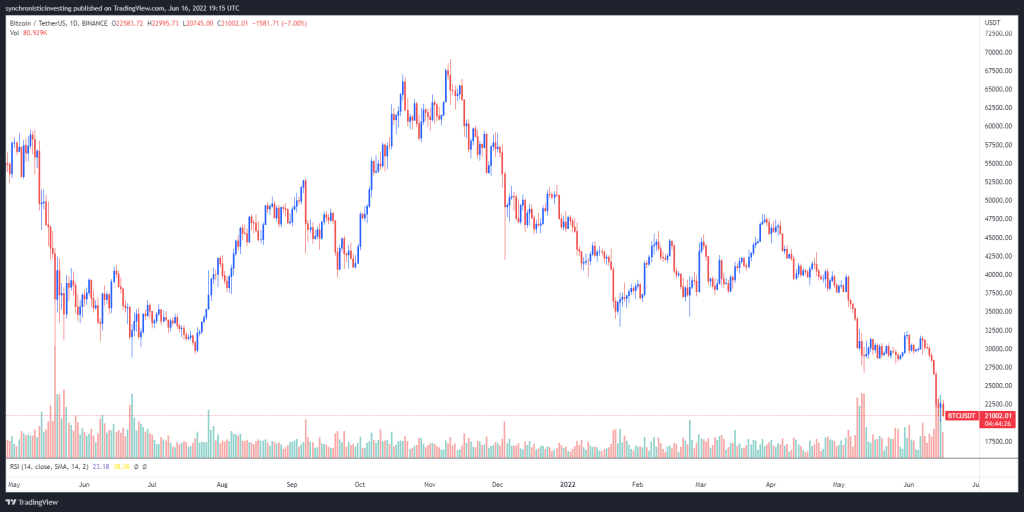
Bitcoin managed to climb as high as $23,000 in the early trading hours of June 16. However, data from TradingView shows that the BTC price is slowly entering a downward trend with decreasing trading volume. According to technical analysis, the next level BTC will reach is $ 20,765. Crypto traders are trying to figure out if the bottom will be found here. However, several analysts in the market are giving predictions for Bitcoin’s next levels.
 bitcoin price
Expect multi-month consolidation at 200-week MA
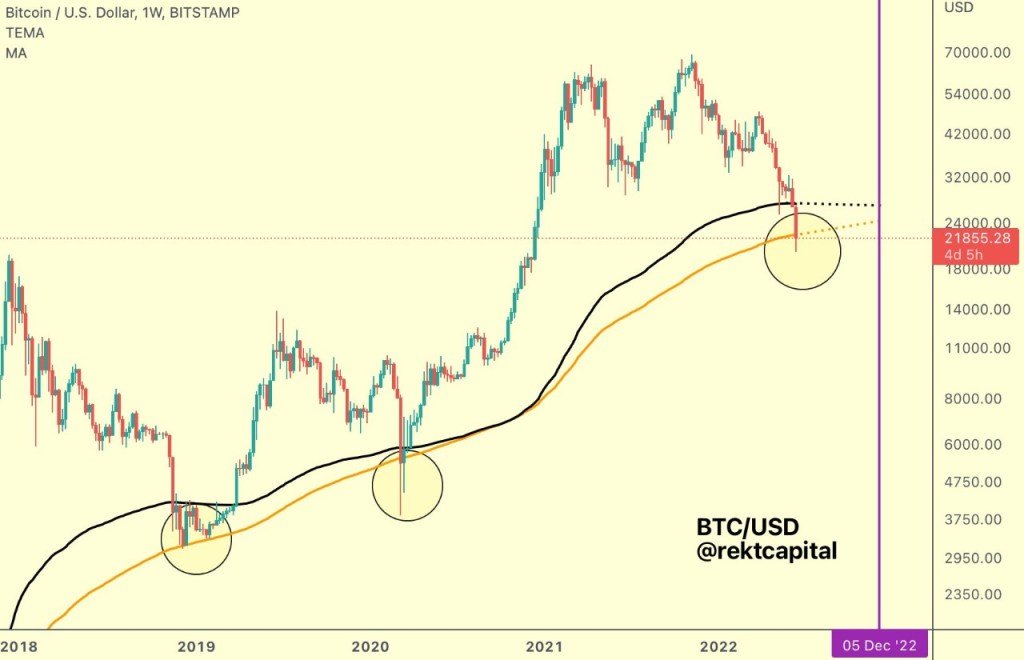
Analyst and alias Twitter user Rekt Capital posted a BTC price chart. Accordingly, the chart highlights the behavior of Bitcoin price close to its 200-week move. He told the analyst:
“BTC may continue to hold the orange 200-week MA as support and the black 200-week EMA as resistance. In this case, BTC will form an Accumulation Range here as it did in 2018. This will continue until December 2022.”
Bitcoin accumulation time 287 days
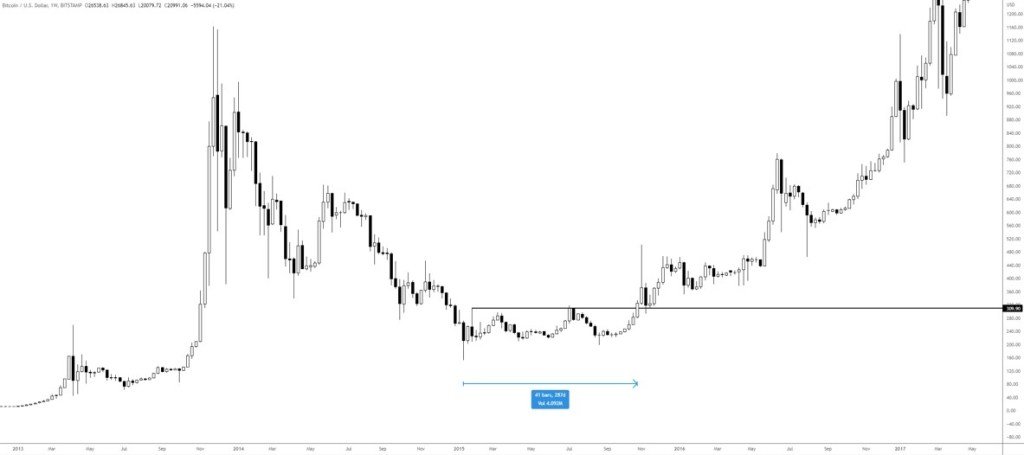
If that’s the scenario that’s possible, investors needn’t be in a rush to hoard BTC. The longest accumulation period noted by altcoin Sherpa is 287 days, which is summarized in the chart below. Other examples provided include 133 days of backlog between November 2018 and April 2019. Also included is 63 days of accumulation between May 2020 and July 2020. Trader said:
“You will probably have plenty of time to catch the bottom in the accumulation phase. It takes some time for Bitcoin to bottom out. So instead of holding a knife, you should go out and touch some grass.”
It is possible for BTC price to retake $25,000
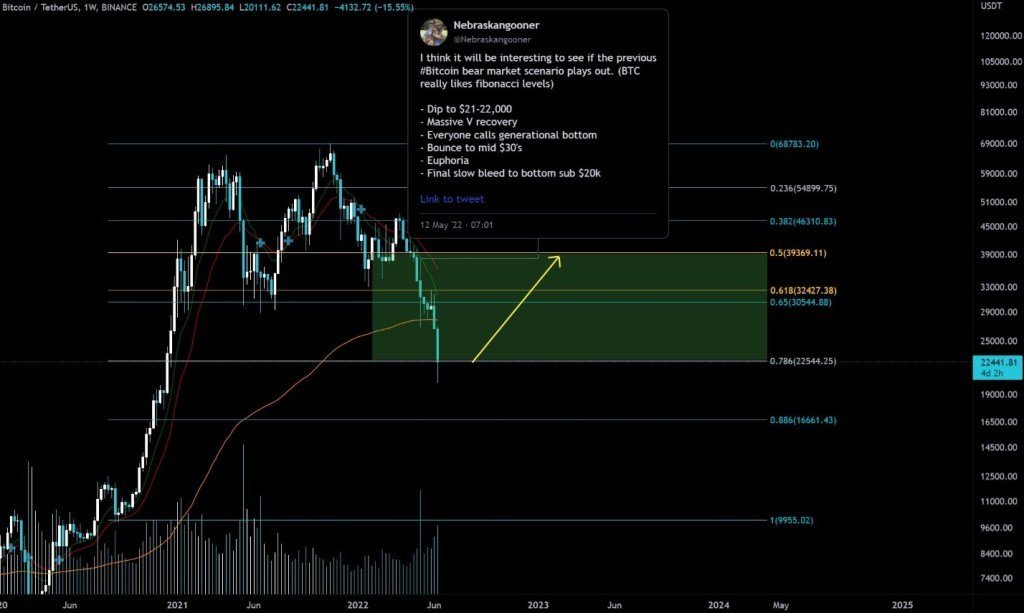
crypto trader Nebraskangooner offered a more positive outlook on recent developments for Bitcoin. The analyst shared a chart stating that “the low Fibonacci level has been reached.” He also said:
“Let’s see if it can make a strong close above the daily resistance. Then we have a shot at $25,000 and possibly mid-$30k. For the first time in months, we may be ready for the leap we’ve been waiting for since $40,000 in crypto.”
RSI 1000 is giving a bullish signal
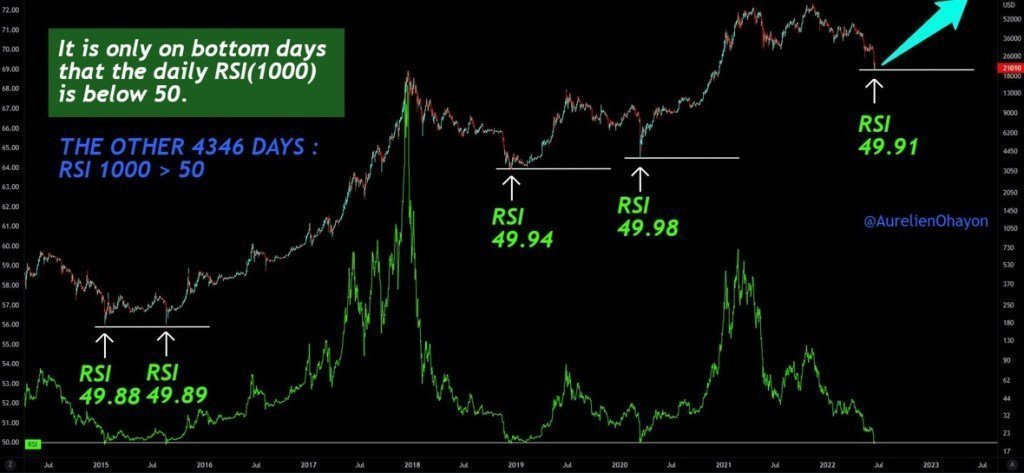
A trader using the alias TAnalyst on Twitter was also bullish for Bitcoin. Allegedly, it has detected a potentially bullish signal on the BTC chart. The relative strength index (RSI) has posted the chart below for 1000, which highlights the recent low. Accordingly, a score below 50, based on the history of the RSI 1000 score, could push the BTC price higher. The analyst said:
When BTC’s daily RSI (1000) drops below 50, we’re seeing pre-bullish bottom days. Today: RSI measured as (1000) = 49.91.”
Short positions no longer make sense
Perhaps the best summary of the current state of the Bitcoin market and the confusion caused by crypto traders was provided by crypto educator IncomeSharks:
“BTC is at a price where shorts no longer make sense. But it’s also in a place where longs are still very high risk. Unless strict risk management is used, this is just spot buying territory for the majority. It is necessary to wait for a trend to develop to start trading again.”
If Bitcoin loses this level, too many liquidations are imminent.
As we reported on Kriptokoin.com , Bitcoin experienced a relief rally after the Fed statement on Wednesday. However, it failed to maintain its momentum. In the last 24 hours, BTC is seeing another big sell trade at the $20,000 tenterhook support. Popular crypto analyst Lark Davis said: “If BTC loses 20k and Ethereum loses thousand, things will change very quickly, be prepared. Too many liquidations could cause a collapse”.