Reviews about Bitcoin and cryptocurrencies continue to come. In our article, we will include the BTC evaluations of seven analysts. But first, let’s take a look at the developments.
Market developments
Investors turned their attention to strong earnings reports from several companies, including Bank of America and Morgan Stanley. That’s why the focus was on the stock market gaining another day. On the other hand, the cryptocurrency market fell on Tuesday. It was a positive day for stocks. But investors continue to weigh the risk of recession against the chances of a soft landing for the U.S. economy after the Federal Reserve’s aggressive rate hikes in 2023. With the closing bell, the S&P, Dow and Nasdaq were up 0.71%, 1.06% and 0.76%, respectively.
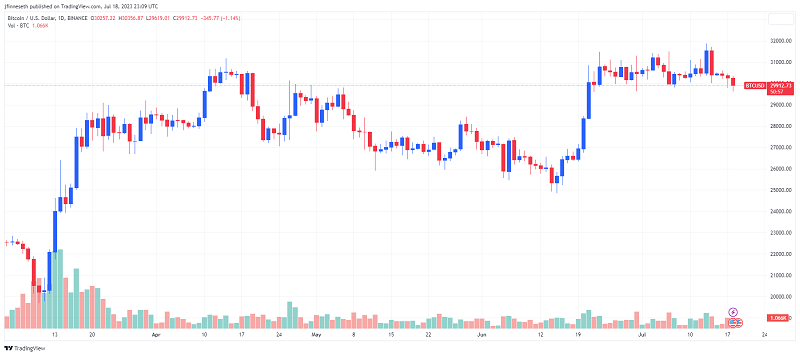
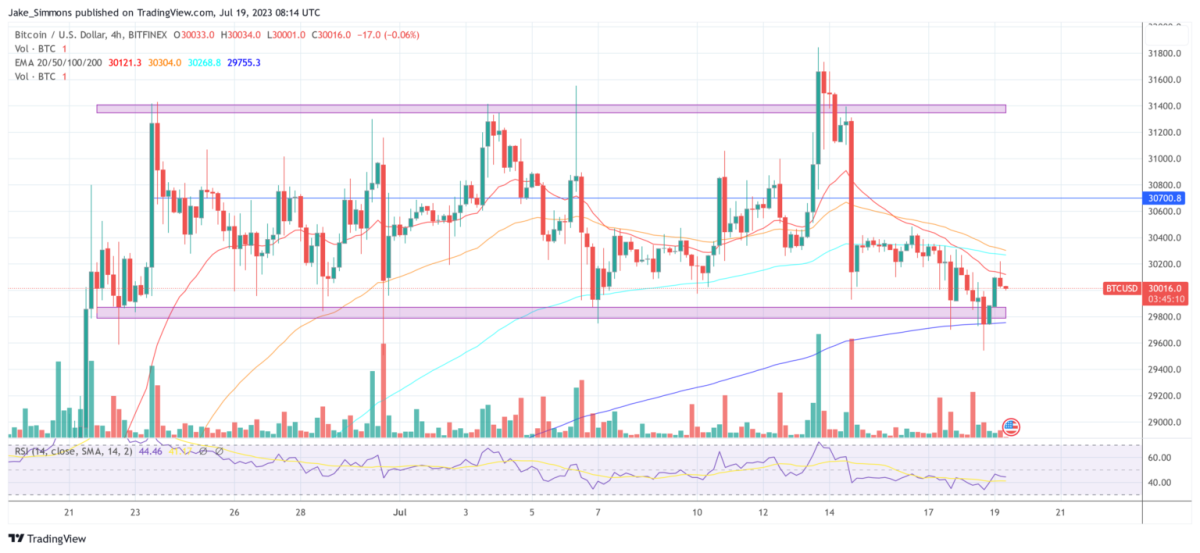
Data provided by TradingView shows that the price of Bitcoin (BTC) has slowly declined throughout the trading day, dropping from $30,258 in the daily open to $29,615 in the afternoon and rising above $29,900 as the bulls attempt to reclaim the $30,000 support.
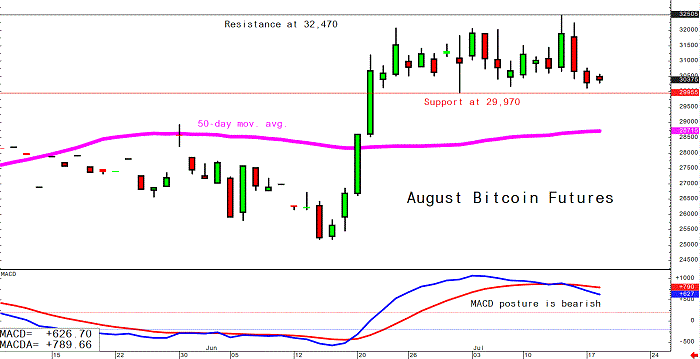
According to Kitco senior technical analyst Jim Wyckoff, Bitcoin futures prices for August traded slightly lower in early US trades. Other than that, “There’s not much new this week,” he said.
Analysts’ opinions
“Prices hit the highest level of the contract last week,” Wyckoff said. However, trading has remained flat since then. It also followed a fluctuating course at higher levels again. The bulls generally have a short-term technical advantage. But to gain new strength, they need to push prices above the recent volatile and sideways trading range.” uses the phrase.
Michaël van de Poppe, founder of MN Trading, noted that lows from a previous candle were swept before the price recovered. However, he questioned whether additional decline is still necessary for the uptrend to continue.
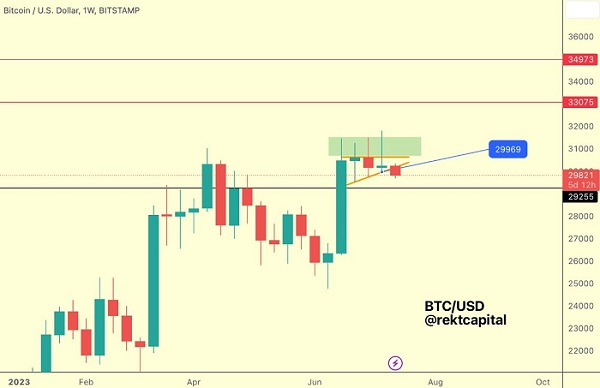
On the other hand, Rekt Capital posted the chart below, stating, “After wicking upwards beyond the around $30600 resistance, BTC was finally rejected to the point of losing its High Low. A Weekly Close below the Higher Low will confirm this loss. Also, as long as the high low acts as resistance, $29,300 may come next.” says.
Market analyst Crypto Tony highlights that Bitcoin is showing signs of weakness. He also states that its price could drop as low as $28,500 in the coming weeks. On the other hand, he states that there will be an increase in the end.
$BTC / $USD – Update #Bitcoin sure looks weak right now so my thoughts on a dip down to $28,500 remains firm. This is something i see playing out in the next few weeks and if we get a slow bleed, #Altcoins should hold well .. And i say should loosely pic.twitter.com/ZPwXZLhtT6
— Crypto Tony (@CryptoTony__) July 18, 2023
Tom Lee: Bitcoin at these levels in 5 years
Tom Lee, managing partner of Fundstrat Global Advisors, came up with an impressive six-figure forecast for Bitcoin (BTC) that has caught the attention of both investors and enthusiasts. In a recent interview with CNBC, Lee expressed his belief that Bitcoin could experience an explosive increase of over 500% from its current level in the next five years.

“Bitcoin could rise to around $200,000 in five years,” Lee says confidently. Such a prediction sparked considerable excitement and speculation within the cryptocurrency community. The fact that Bitcoin is currently trading at $29,982 makes Lee’s prediction even more interesting. Explaining the rationale behind the ascension thesis, Lee underlined the undeniable usefulness of Bitcoin. Many people in the United States believe that the financial system works well for everyone. However, he pointed out that the system is particularly advantageous for those who already have wealth. Lee acknowledges the limitations of the current system. Accordingly, it highlights the enormous potential that Bitcoin has for individuals seeking alternative financial solutions.
PlanB updates its forecasts for Bitcoin
In a recently released video, PlanB, known for developing the stock-to-flow (S2F) model, proposed a Bitcoin price prediction in the $40,000 to $50,000 range prior to the halving. It should also be noted that the analyst was criticized last year when the S2F model was not correct. But in his latest video, he used the 200-week moving average as a tool to predict the potential future trend of the flagship cryptocurrency’s price.

True to his word, the 200-week moving average, a common indicator used in technical analysis that helps smooth out our price data, is rising by about $500 per month. Accordingly, this means an increase of $ 4,500 from about $ 28,000 to $ 32,000 in nine months. The analyst emphasizes that Bitcoin “will be above this, and usually above 50%. In this case, Bitcoin will be somewhere between $40,000 and $50,000,” he added.
Robert Kiyosaki reveals BTC price
Robert Kiyosaki, known for “Rich Dad Poor Dad”, states that Bitcoin could rise to an astonishing $120,000 in the near term, at a time when BRICS countries are preparing to launch a gold-backed currency. The bestselling author’s price target appears to be in line with that of Standard Chartered, a London-based multinational banking and financial services firm. The bank recently stated that the price of BTC could rise to $50,000 this year. It also suggested that it would exceed $120,000 by the close of 2024.

Bitcoin statement from Standard Chartered analyst
Geoff Kendrick, one of the leading currency analysts at Standard Chartered, states that the bank had expressed an “upward” view of 20% in its previous call. It has also now voiced an optimistic revision to this forecast.
The upside was related to increased miner profitability per BTC. This “means that they can sell less while protecting their cash inflows.” According to Kendrick, this will also reduce the net BTC supply. It will also raise the price of the cryptocurrency.
Analyst CryptoCon draws attention to this correlation
In a recent newsletter by renowned analyst CryptoCon, a groundbreaking indicator known as the “Bitcoin DXY correlation coefficient” has caught the attention of the community. Measuring the correlation between Bitcoin and the US Dollar Index (DXY), this indicator has shown remarkable accuracy in predicting Bitcoin’s price movements and signaling the beginning of bull market parabolas.

According to CryptoCon, the Bitcoin DXY correlation coefficient is “one of the most interesting findings” it has come across in a while. The analyst highlights three different stages the correlation coefficient enters during a market cycle. “During a given market cycle, the correlation coefficient enters this region in 3 stages,” he says. These stages are represented by different colors:
- PURPLE: Initial move to the low correlation zone, occurring just before the bottom of the bear market.
- RED: Second move to the low correlation zone. It marks the end of the bear market or the bottom of the cycle.
- GREEN: After a while, the metric returns to the low correlation region. It also marks the beginning of the true bull market parabola.
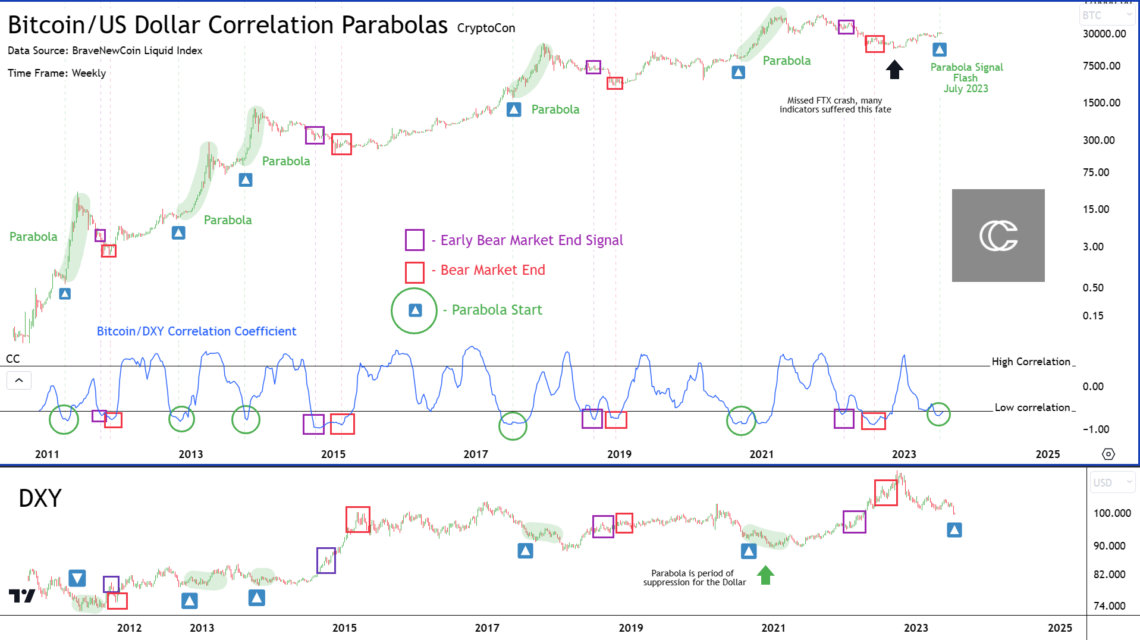
The analyst also points to the impact of the US dollar on Bitcoin’s parabola. He explains: “This is because of an external factor. So dollars. So the strength of the US dollar has a huge impact on when the Bitcoin parabola will form.” This correlation adds an additional layer of complexity. It also highlights the interaction between these two market forces.
Price estimated between 90k and 130k
The analyst speculates on Bitcoin’s potential future trajectory by making comparisons to the 2013 cycle. He suggests that the upcoming market cycle might look like a two-curve model. He further elaborates on the time periods of these curves, saying: “The first comes early. Probably ends in 2024. The second comes later. Also, according to my November 28 Cycles Theory ends in late 2025.”
cryptocoin.com Looking at it as a whole, the analyst also shared his price predictions for the upcoming bull market parabola. He says: “As for the price target of this parabola, I’ll talk about the first one. Personally, I would expect the ATHs to come just above or below. The secondary will then peak at 90-130,000 which is my personal range and projection for the cycle. Whatever happens in the short term, big things are on the horizon for Bitcoin, according to the data.” says.


