Different predictions for Bitcoin price keep coming. Now we will include nine different BTC predictions for you.
Bitcoin prediction from Credible Crypto
In a new video, analyst Credible Crypto addresses his 343,200 Twitter followers. He says that Bitcoin is currently witnessing a five-wave uptrend. Popular Elliott Wave practitioner Credible Crypto predicts that Bitcoin (BTC) is currently in the middle of the third major wave, setting the stage for a parabolic move to the upside. According to Elliott Wave theory, the third major wave is the strongest. Accordingly, Credible Crypto expects rapid expansion when BTC exits its current consolidation.
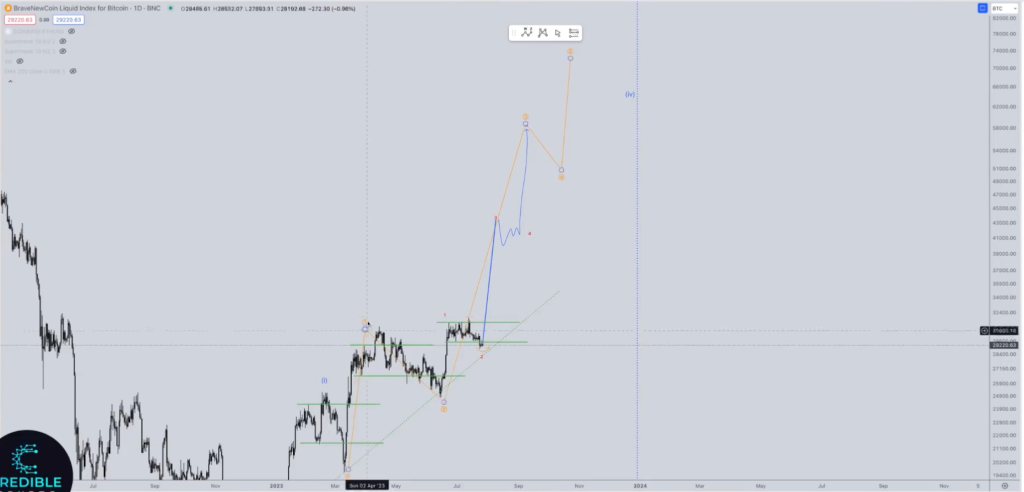
He predicts that BTC could reach $42,000 or more in the next move to the upside. Credible Crypto’s chart shows that the third major wave of Bitcoin could push the price above $58,000 by October, then pull back to $49,000 to complete the fourth major wave. The chart also shows that BTC could rally as high as $75,000 by November to complete its five-wave uptrend.
Increase expectation from analyst Jelle
Bollinger Bands, developed by John Bollinger, show that Bitcoin is currently experiencing an unusually quiet market period with low volatility. This shows that a big move for Bitcoin is on the horizon.
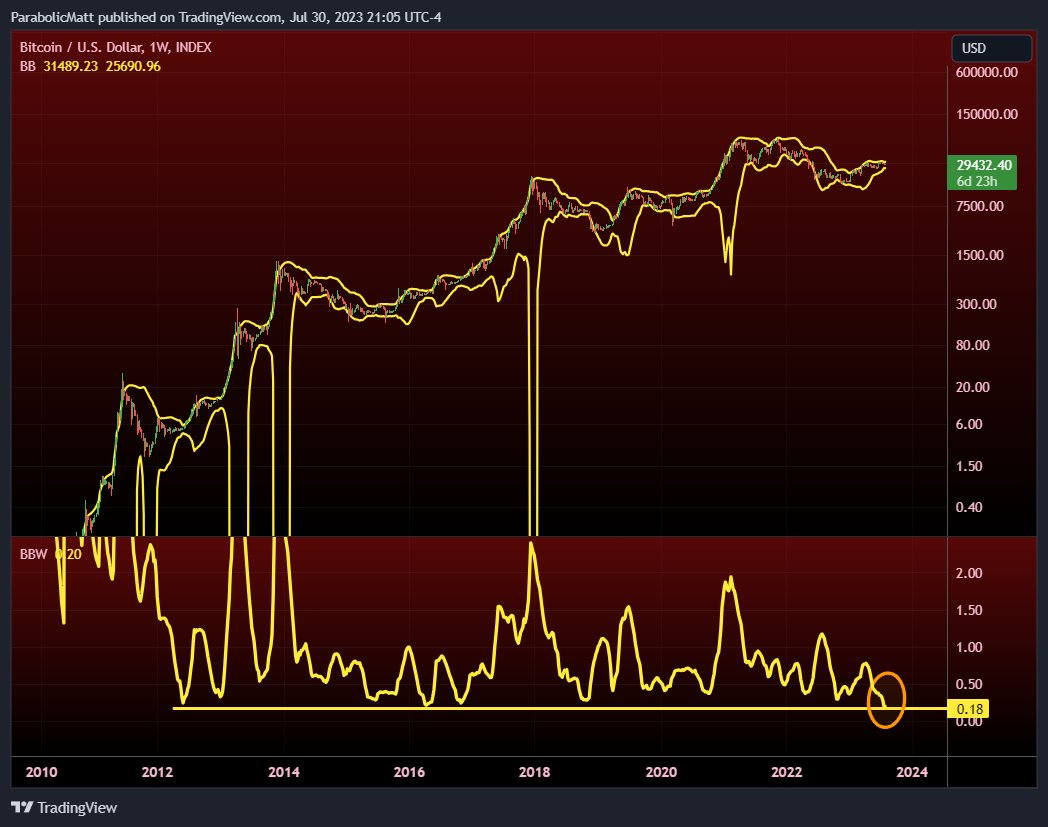
Crypto analyst “Jelle” predicts a significant move is imminent. Also, according to him, the weekly Bollinger bands have never been as tight as they are now. This signals the potential for fireworks soon for analyst Jelle. Jelle expects this week to be slow, but anticipates the real action will begin next week.
Bitcoin approach by Dan Gambardello
Dan Gambardello, founder of Crypto Capital Venture and host of a popular YouTube channel, thinks the Bitcoin market is in an intermediate stage. He describes this period as potentially painful and mentally challenging for traders and investors awaiting the start of the bull market after the winter market. Despite the challenges, Gambardello sees this phase as a season of opportunity. It also highlights the importance of creating a game plan for the future.

Using the Fibonacci retracement and the CCV indicator on the Bitcoin chart, Gambardello explains how he is preparing for the upcoming bull market. He describes a particular region on the chart as the “bull market gate”. Accordingly, it indicates where the next bull run will start. But it doesn’t predict the exact timing. It compares the current market situation with previous pre-bullish trends, suggesting a potential four-hundred-day window for the setup to evolve. He advises crypto investors to avoid distractions during this time. On the other hand, he advises them to prepare for the upcoming bull run.
Bitcoin prediction from Lark Davis
According to prominent investor Lark Davis, Bitcoin (BTC) will finally break out of its “boring” cycle in the next 18-24 months. Despite many positive developments in the market, the volatility of BTC is noticeably lacking.
Bitcoin boring AF, but for how long? Mainstream media shilling Bitcoin. Plus the big new money making narratives. https://t.co/Yg3nU7Uojn
— Lark Davis (@TheCryptoLark) July 31, 2023
As of now, Bitcoin is trading at $29,398.62. It has also gained a modest 0.39% in the last 24 hours. However, Davis remains optimistic that significant changes are on the horizon for the leading cryptocurrency.
BTC advice from Robert Kiyosaki
Robert Kiyosaki, the author of the book “Rich Dad Poor Dad” makes important statements. He criticizes the Wall Street Journal’s statement that the US economy is strong. Accordingly, he stated that America was bankrupt. He believes the rise in the stock market is due to the US government raising the debt ceiling, which reached $31.4 trillion this year.

Kiyosaki prefers to invest in safe-haven assets such as Bitcoin, gold and silver. In his previous tweets, he had discussed the impact of the US national debt on the stock market and Bitcoin. Kiyosaki seems optimistic about Bitcoin price. He believes BTC will reach $100,000 or $120,000 by the end of next year.
Huge Bitcoin prediction from TechDev
TechDev, the pseudonymous analyst with a substantial Twitter following, closely monitors global liquidity cycles, using Chinese 10-year bonds (CN10Y) and the US dollar index (DXY) as indicators. He states that global liquidity is on the verge of an uptrend as major central banks expand their balance sheets. He also suggests that Bitcoin is following this trend closely.
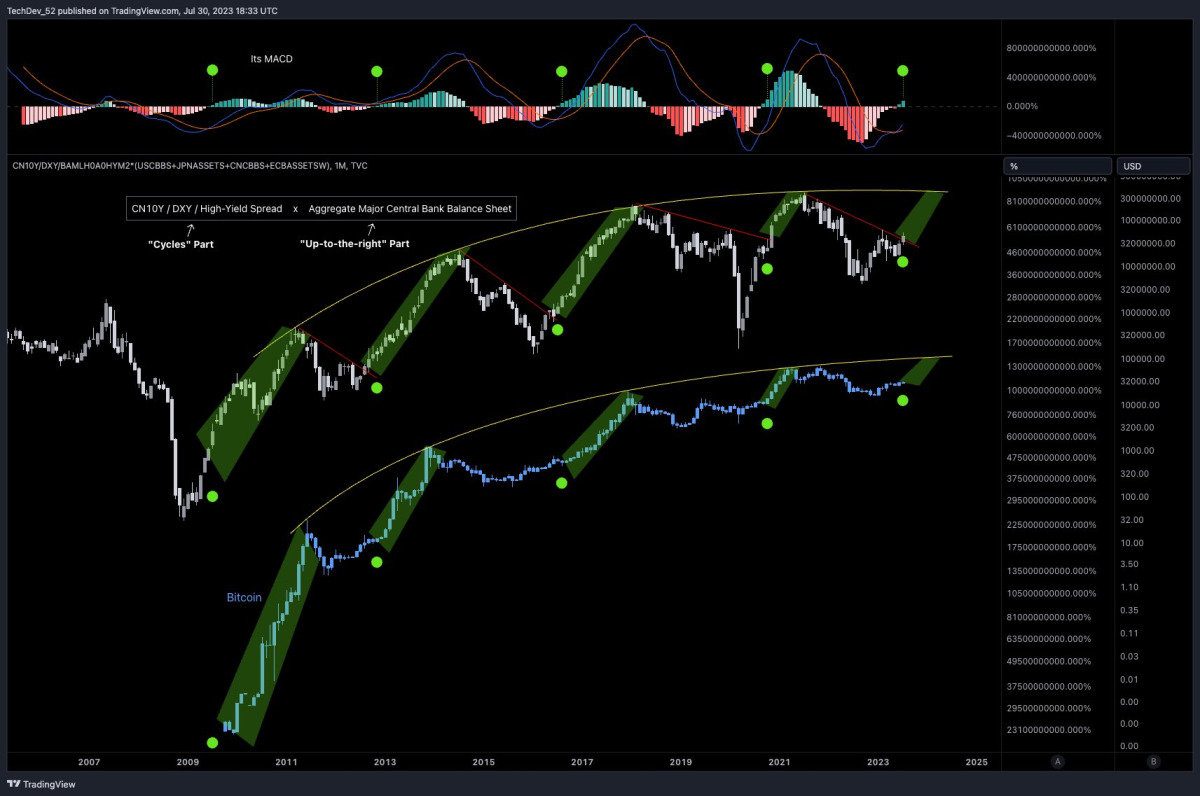
TechDev states that Bitcoin may reach its logarithmic growth curve (LGC) in 2025 or before. Accordingly, he estimates the upper limit of LGC to be in the $100,000 – $140,000 price range. He notes that the width of BTC’s Bollinger bands is relatively low, and previous examples of such compression have led to significant bull markets. The analyst’s approach represents an increase of about 380% for Bitcoin.
Bitcoin bull time comment from Captain Fabik
There is an analysis shared by Captain Fabik, a popular trader. Accordingly, Bitcoin “formed another monthly candle. It closed below $30,000. Faibik believes that while BTC is heading towards a bull run, it is currently still in accumulation. Chain analytics firm Santiment also points to whales hoarding stablecoins.
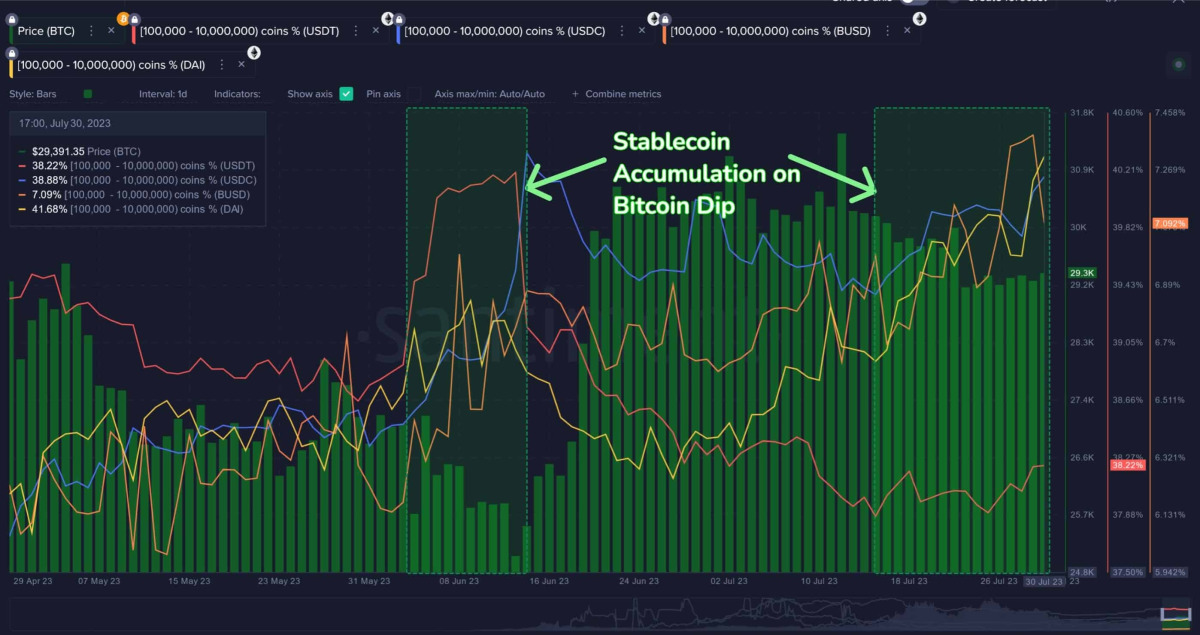
Stablecoin accumulation is important. It allows traders to prepare to take their positions. It also often indicates that a major breakout is imminent in leading digital assets such as Bitcoin and Ethereum.
Bitcoin in a new process
Bitcoin price is trying to rise above $30,000. However, the lack of liquidity in the crypto market is causing consolidation between $29,000 and $30,000. Bitcoin remains stable amid the hack at the $100 million Curve, despite facing resistance at $29,500.
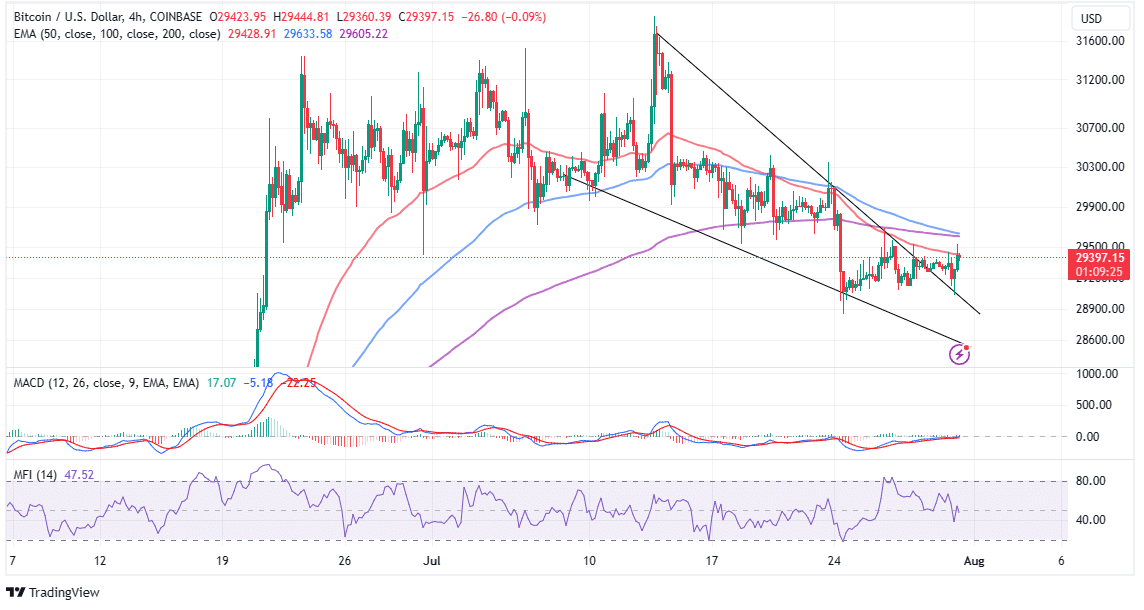
The 50-day Exponential Moving Average at $29,428 is currently limiting upward movement. Bitcoin BTC will potentially return to $29,000 for fresh liquidity before continuing its uptrend. The Moving Average Convergence Divergence (MACD) gives a buy signal, strengthening the bullish sentiment if it breaks above the average line (0.00).
BTC points to bullish outlook
Bitcoin (BTC) price recently broke below a horizontal resistance area, indicating a bearish outlook on the daily timeframe. The Relative Strength Index (RSI) is also pointing to a bearish divergence with a triple bearish divergence. With this, cryptocoin.com When we look at it as a whole, this indicates that the correction of short-term wave count BTC is nearing its end. It also shows that BTC could reach a bottom soon.
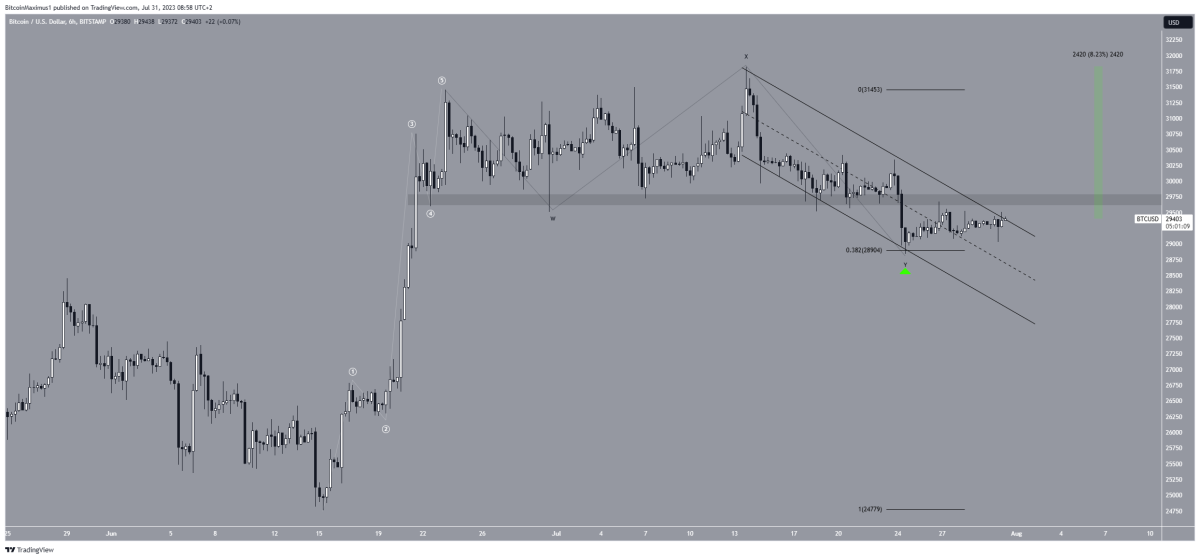
Fibonacci’s bounce at the 0.382 retracement level and the support line of the channel support the corrective action idea. If BTC breaks out of the resistance line of the channel, it will potentially reach its yearly high of $31,800. It also marks an 8% increase from the current price.