
Etherum has risen in price after 2022
Ethereum, the strongest of the altcoins, has reached $ 1900 again in the past days. After Ethereum’s price action, it has been sideways for a few days. However, we have discussed for you where the price can go in Ethereum.
Ethereum Price Analysis
Looking at the price chart of Ethereum, it shows that Ethereum is trading around $1,900 and has consolidated in a wide range between $1,800 and $1,900 over the past few days. Despite a minor bearish pressure, the coin has been trading in an uptrend since the beginning of this month.
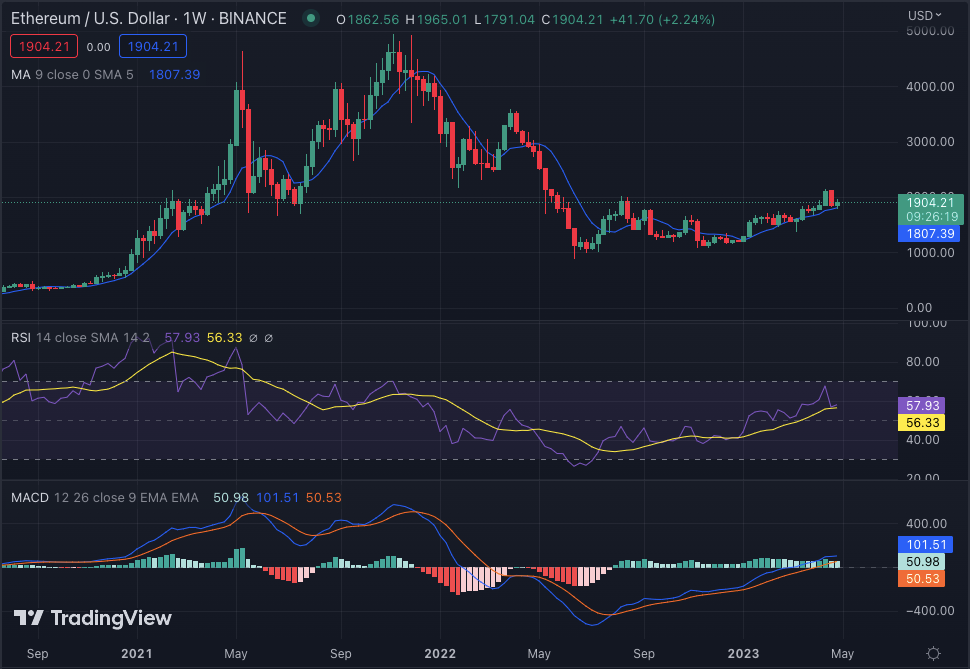
The MACD indicator gives a slight bullish signal as it moves above zero and has remained there for the past two weeks. The RSI is already above 50 and the weekly moving average is seen at $1,807. The 50-Week moving average is slightly higher at $1807 and if the price drops, it is likely to provide strong support.
This price action in Ethereum will be affected by the developments in the coming days. However, in a possible bearish scenario in the coming weeks, the $1,700 – $1,800 band can be realized.