According to technical analyst Ross Burland, the gold price is still in the bears’ den. The analyst says the bears want to break the key support zone. Crypto analyst Rakesh Upadhyay notes that Bitcoin and certain altcoins show strength in the short term.
Gold is in the hands of the bears!
According to the previous week’s pre-open price analysis, the golden bears are targeting a run to test $1,970. The gold price is in the hands of the bears for now. Thus, it remains in the bears’ lair with a bearish bias for the week ahead.
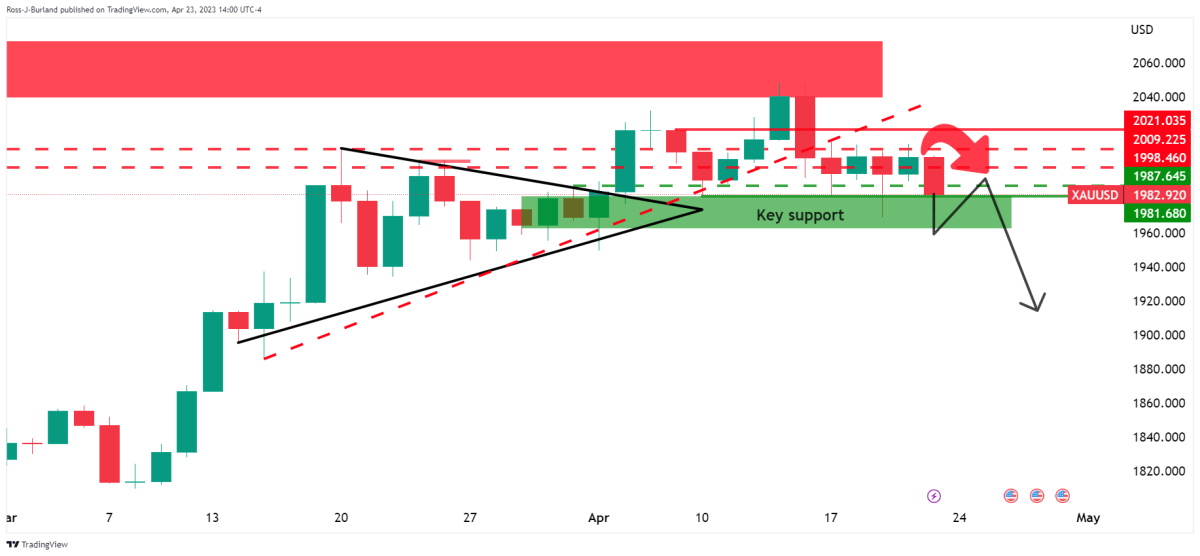 monthly chart
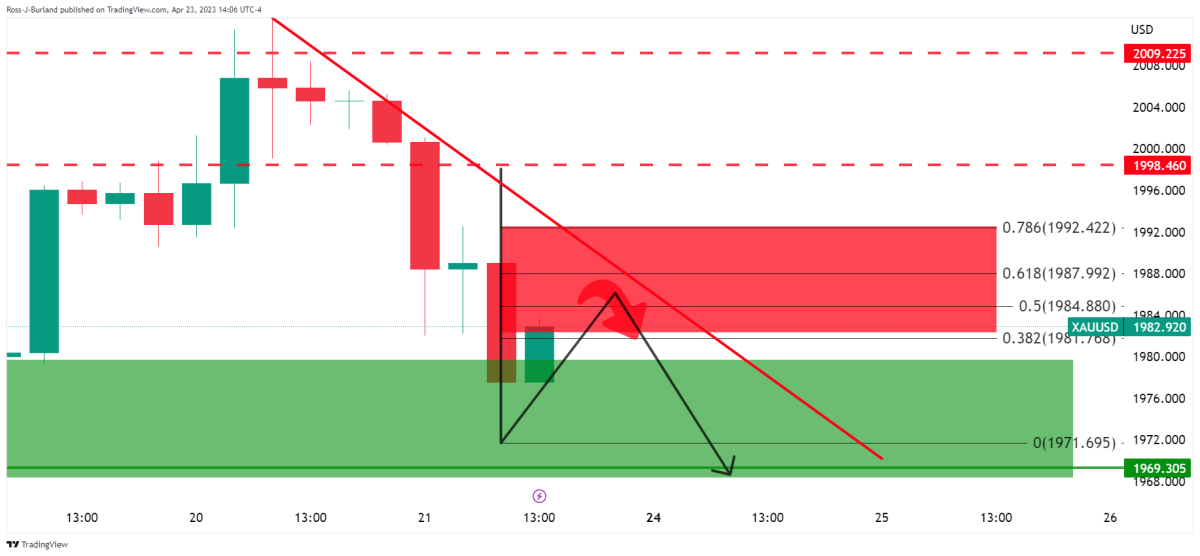 daily chart
Gold is generally bearish
As shown in the charts above, the gold price encountered support and the price corrected. As long as gold price stays ahead of the downtrend line, it will struggle to maintain its corrective momentum. Accordingly, $1,970 will be the next key target for the bears. Now let’s look at the gold price updates.
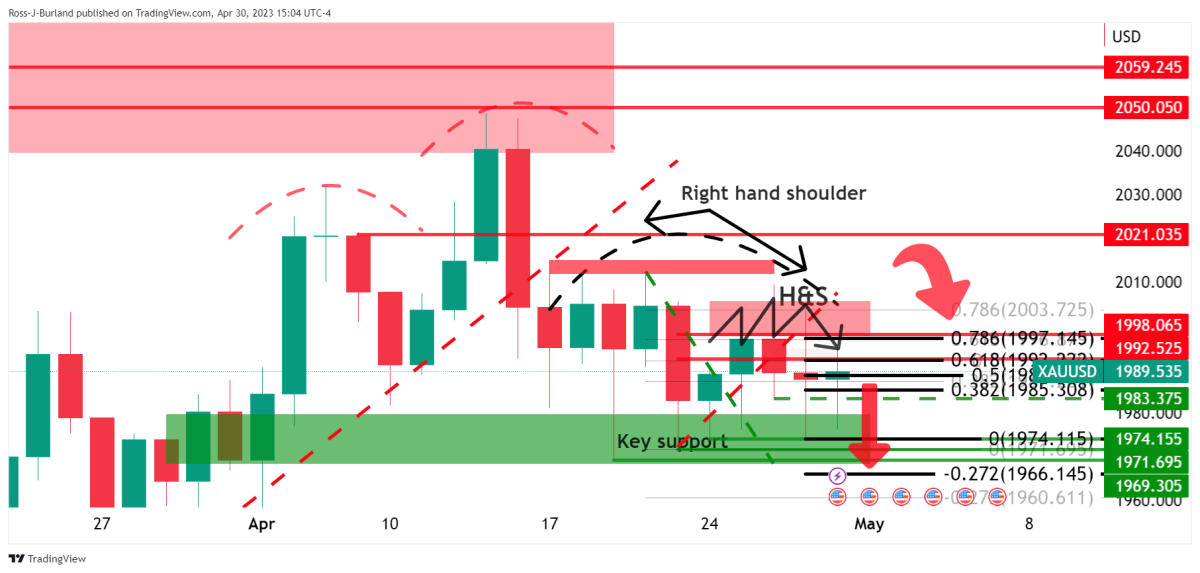 monthly chart
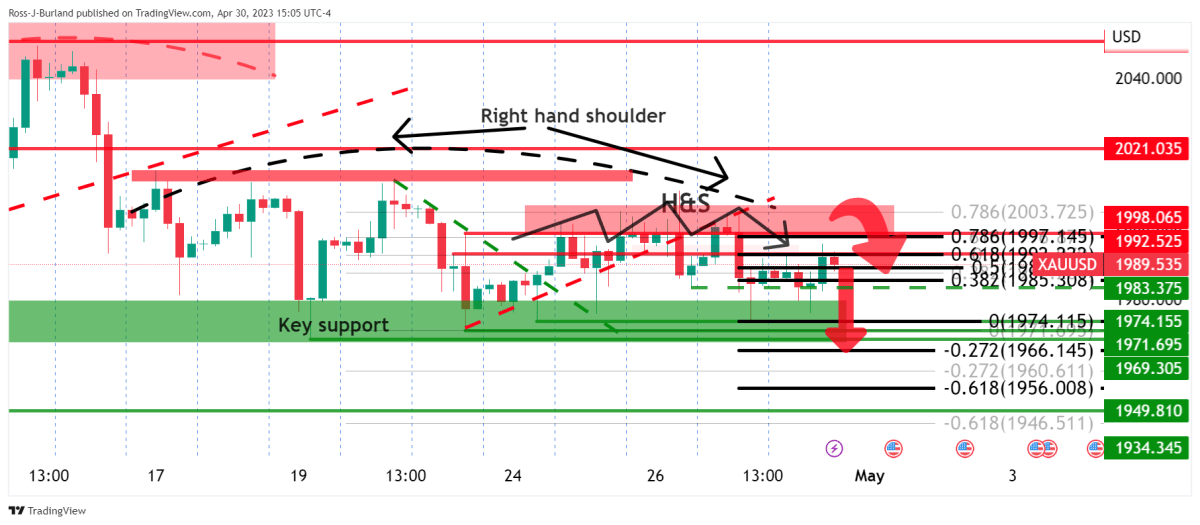 daily chart
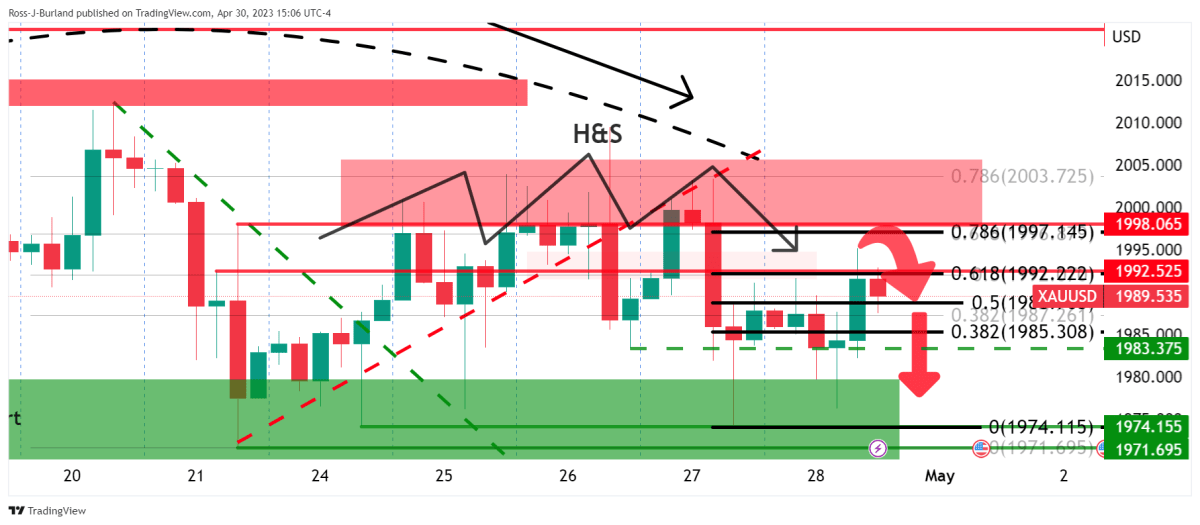 4 hour charts
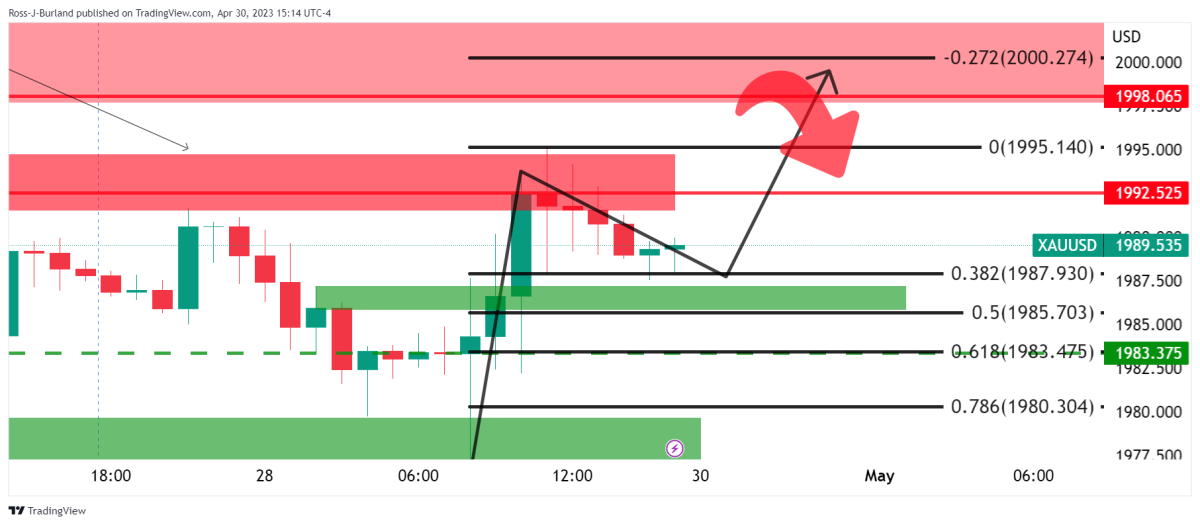 1-hour gold price chart
The trend of the yellow metal is bullish for the opening. However, it is generally bearish when below $2,000.
An overview of the cryptocurrency market
Risky assets continued to rise marginally in April. The S&P 500 Index rose around 1.5% in April, while Bitcoin closed the month with gains of over 4%. Can the rally continue in May or is it time to withdraw? The recovery could face headwinds if US banking problems escalate further. Bob Michele, chief investment officer at JPMorgan Asset Management, says the turmoil at First Republic Bank will not be confined to the bank alone and could have a domino effect.
 Crypto market data daily view / Source: Coin360
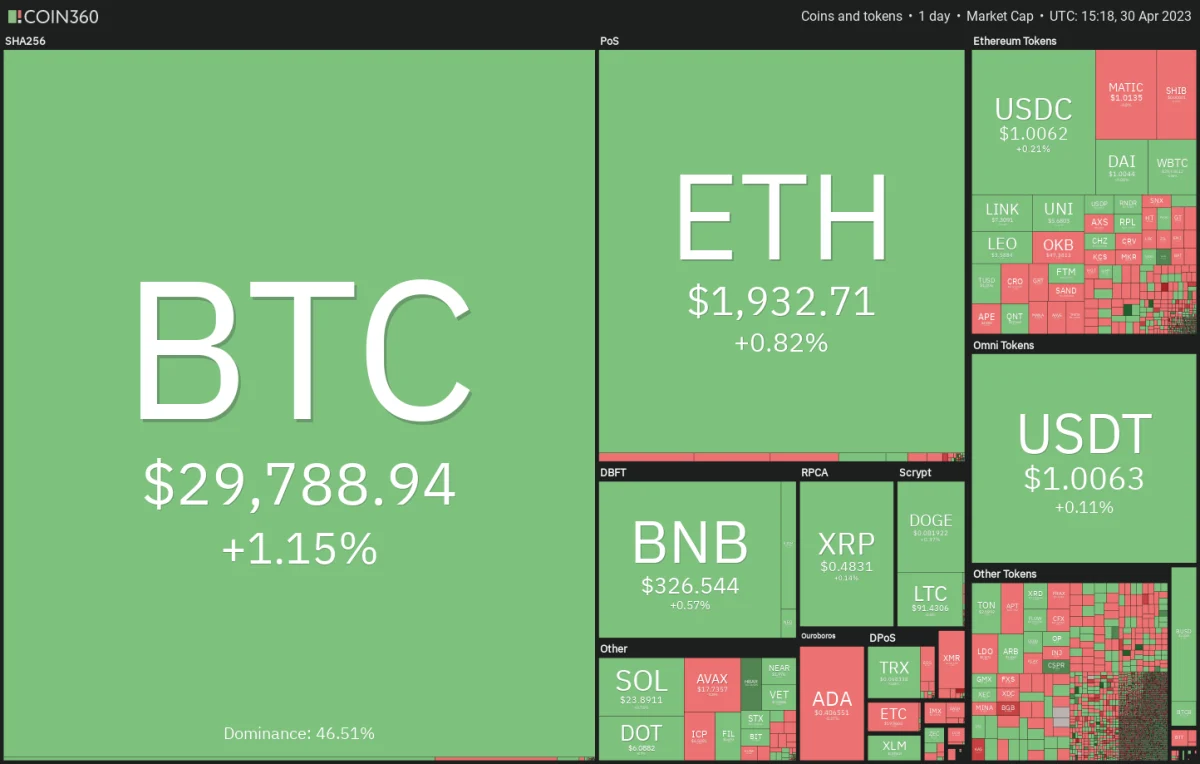
If that happens, the US stock markets could witness a correction. However, it is difficult to predict how Bitcoin will respond to such a crisis. Because over the past few days, BTC has soared as old banking problems deepen. But in case of major upheaval in the US banking industry, it’s possible that Bitcoin will also face a correction sooner or later. In the near term, Bitcoin and certain altcoins are showing strength.
BTC analysis: Bulls try to show their superiority
After two days of low volatility trading in Bitcoin, the bulls are trying to assert their dominance on April 30.
 BTC daily chart. Source: TradingView
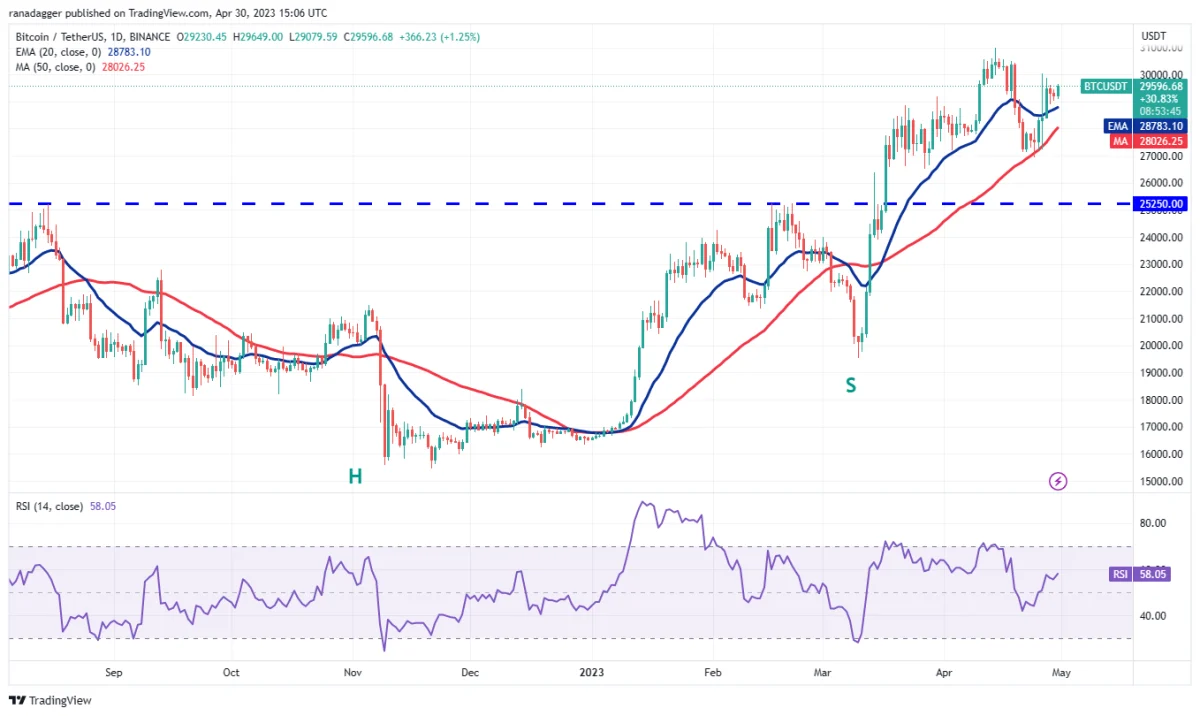
The 20-day exponential moving average ($28,783) has started to rise gradually. Also, the relative strength index (RSI) is in the positive territory. This indicates that the path of least resistance is up. If the bulls propel the price above $30,000, BTC is likely to rise to the overhead resistance zone between $31,000 and $32,400. However, buyers are likely to face tough resistance in this region. However, if this resistance is overcome, BTC is likely to rally towards $40,000.
The 50-day simple moving average ($28,026) is an important support to consider. If the BTC price drops below this level, the bears will sense an opportunity and try to lower BTC to $25,250.
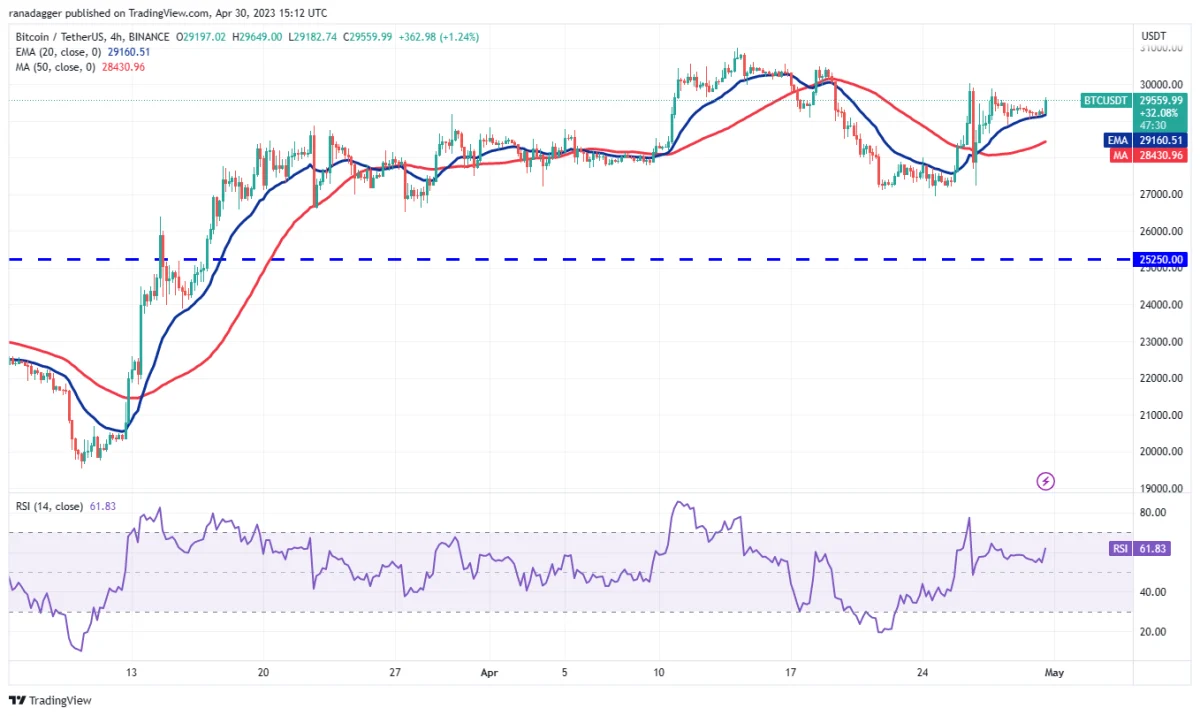 BTC 4-hour chart / Source: TradingView
The bears tried to push BTC below the 20-EMA. But the bulls held their ground. This may have led to more purchases. The bulls will try to push the price above $30,000 from now on. If they are successful, it is possible for Bitcoin to rise as high as $30,500 or even $31,000.
Conversely, if the price drops and breaks below the 20-EMA, it will indicate that the bears are selling near the overhead resistance levels. There is a possibility that BTC will slide to the 50-SMA later on. The bulls will try to maintain this level. But if the bears outrun them, the next stop will likely be $27,000. Buyers are likely to defend the region between $27,000 and $25,250 with all their might.