
While the dollar remains strong, cautious investors await the Federal Reserve’s decision to raise interest rates this week. In the midst of this wait, gold prices fell on Monday. Analysts interpret the market and evaluate the technical outlook of gold.
That won’t bode well for yellow metal, but…
Consumer spending in the US remained unchanged in March, according to data released on Friday. Thus, inflation pressures remained strong. It is possible that this situation will cause the US Federal Reserve to raise interest rates. cryptocoin.com As we have announced, the Federal Open Market Committee (FOMC) meeting will take place on May 2-3. Investors are largely expecting a 25 basis point rate hike. Ilya Spivak, head of global macro at Tastylive, comments:
If the Fed unexpectedly makes a hawkish decision, it will not bode well for gold. However, I do not expect prices to drop below the $1,930 level. If we see a meaningful decline in US economic data in the second half of this year that widens interest rate cut expectations, it is possible for gold prices to rise above $2,000.
Meanwhile, JPMorgan Chase & Co. He made a statement on Monday. In this context, he noted that First Republic Bank has purchased a significant majority of its assets. It also announced that it has assumed some of its obligations.
For gold prices key levels
Technical analyst Anil Panchal assesses the technical outlook for gold. Gold price is trading lower in a short-term trading range above $2,000. Still, the dollar’s recent rally, supported by optimistic US inflation cues, is putting pressure on the gold price. Along the same lines, hawkish Fed bets and poor April Chinese PMI data are weighing on gold.
According to the Technical Confluence Indicator, gold price remains under pressure below the $1,990 resistance. However, the indicated level includes the one-week and one-month Fibonacci 61.8%, as well as the one-day Fibonacci 38.2%.
In addition to the $1,990 barrier, the 5-DMA and Fibonacci 23.6% near $1,993 are also limiting the rise of short-term gold. Even if gold price breaks the $1,993 barrier, a joint of the previous day’s high and one-week Fibonacci 38.2% near the $1,998 mark would precede the $2,000 psychological magnet to challenge gold buyers. Meanwhile, the metal’s southward path looks smoother with minor supports near $1,980, which includes the Pivot Point one-day S1. Following this, the $1,970 support level, which includes the lower one-day Bollinger band and one-day Pivot Point S2, is likely to act as the last defense of gold buyers.

Gold technical analysis: Further decline possible
Technical analyst Sagar Dua is also evaluating the technical picture of gold. Gold declined towards $1,970.00, a key support in the Asian session. DXY is seeing a strong recovery amid optimistic expectations that the Fed will raise rates by 25 bps. This also affects the gold price. The precious metal slumped below $1,970.00, which has acted as an important support since last week. Now it is likely to show a significant drop from here.
Investors are waiting for the Fed’s monetary policy for decisive action. Gold price has been consolidating in a narrow range of $1,971-2,021 since last week. Meanwhile, the upward sloping trendline at $1,934.34, the March 22 low, is acting as a buffer for gold bulls. The 20-period Exponential Moving Average (EMA) at $1,990.28 is sticking below, indicating a lackluster performance. Meanwhile, the Relative Strength Index (RSI) (14) is on the verge of entering the 20.00-40.00 bearish range, which will fuel the bearish momentum.
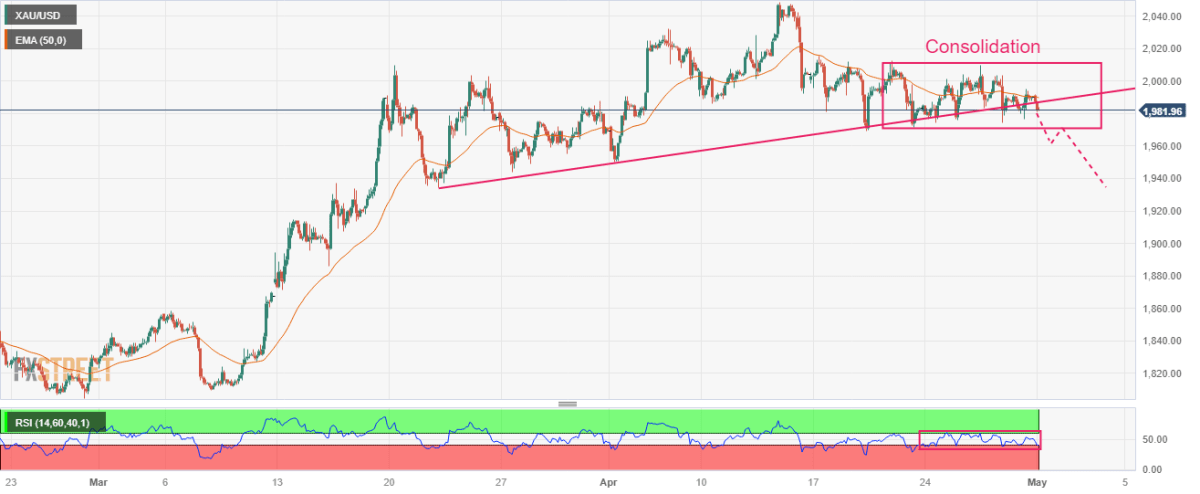 Gold two hour chart