The top two cryptocurrencies by market value, bitcoin (BTC) and ether (ETH) have rallied 70% and 56% this year, outshining traditional risk assets by a significant margin.
However, the good times may stop rolling if the heavily shorted U.S. dollar, which has recently found a “double bottom” price floor against major fiat currencies, sees a short squeeze – a rally powered by an unwinding of bearish bets, as per Singapore-based options trading firm QCP Capital.
“The biggest obstacle for crypto remains the USD – where we think the market is heavily positioned to the short side and vulnerable to a short squeeze, which could take BTC/ETH and Gold lower in response,” QCP’s markets insights team said in a note shared with CoinDesk.
Bitcoin has historically moved in the opposite direction to the dollar index. The negative correlation between the two has recently strengthened, meaning a short squeeze in the dollar could weigh over the leading cryptocurrency and the broader market.
Shorting refers to taking bearish bets on an asset’s price. A short squeeze occurs when the heavily shorted asset moves higher, forcing bears with open short positions to buy back the asset to cover losses. That, in turn, adds to upward pressure on prices.
The dollar index, which gauges the greenback’s exchange rate against major fiat currencies, peaked at 114.78 in late September last year and has fallen over 13% since then on hopes the Federal Reserve (Fed) will pivot away from interest rate hikes. According to Scotiabank data sourced from Wall Street Journal, hedge fund managers’ bets against the dollar rose to around $12.2 billion as of April 25.
Will the dollar see a short squeeze?
The greenback could see a short squeeze if Fed chairman Jerome Powell maintains a data-dependent policy stance on Wednesday, contradicting markets positioned for hints of a so-called dovish pivot in favor of renewed rate cuts.
“Looking at the Fed pricing, you can certainly say the pivot is fully priced in. It is the U.S. banking crisis/debt ceiling/recession that is the beta for the USD from here. We believe that the 12% drop in the USD is pricing in the more pessimistic scenarios on these three and which we believe make it ripe for a short-term squeeze,” QCP’s team told CoinDesk.
The Fed funds futures show traders expect the Fed to deliver it’s final 25 basis point rate hike later Wednesday and resort to rate cuts from July. The central bank kicked off its tightening cycle in March last year, roiling risk assets, including cryptocurrencies, and has raised rates by 475 basis points since then.
Double bottom in DXY
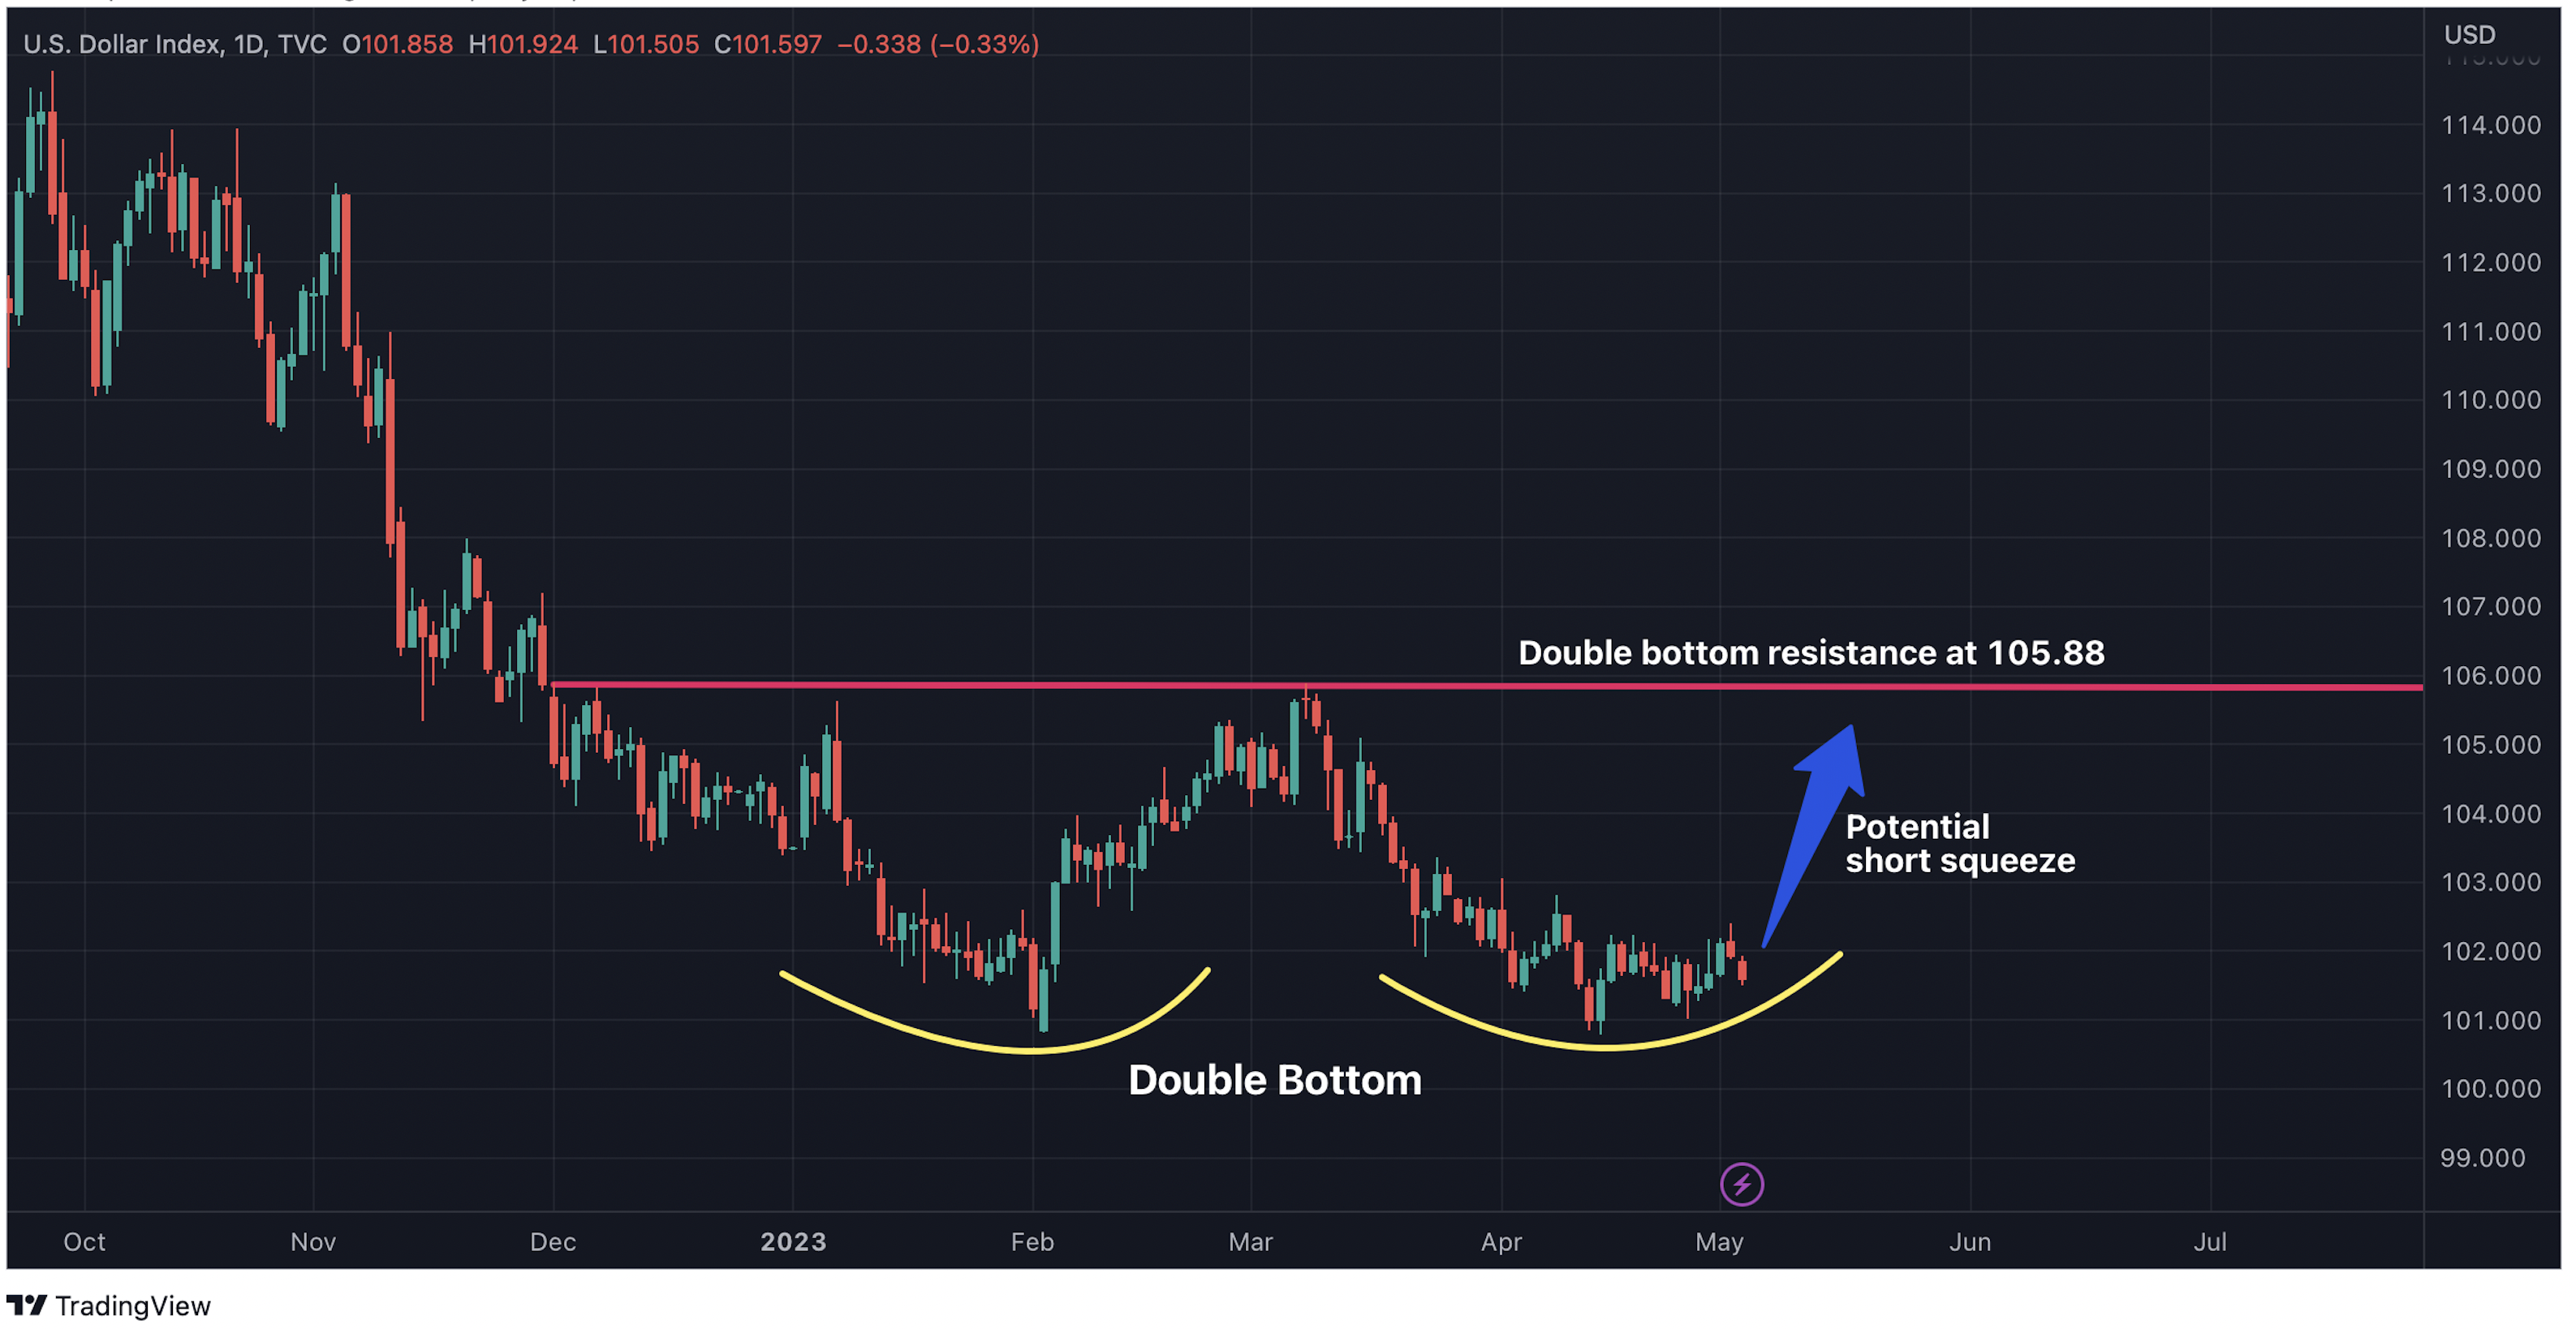
Two weeks ago, the dollar index bounced up from levels close to its February low of 100.82, confirming what is known as the bullish “double bottom” pattern in technical analysis.

The DXY has recently found a double bottom. (TradingView/CoinDesk) (TradingView/CoinDesk)
The pattern tells us that buyers have held strong twice around the same area, creating a floor for a move higher in prices.
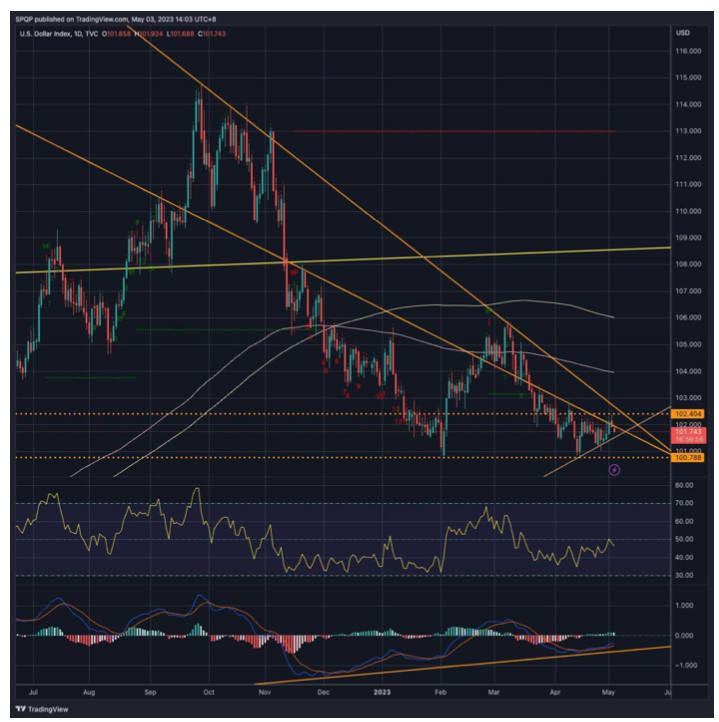
“We note the positive divergence in RSI and MACD, and a potential double bottom at 101,” QCP’s insights team said. “For the USD (DXY), the key level to the topside is 102.5, where we expect a break higher to lead to a sharp correction lower in crypto.”
Recommended for you:
- Trump Digital Trading Card Project Mints NFTs for Winners of Prizes
- Diana Biggs: Building Early-Stage Ventures in Web3
- CBDCs Are Going to Disappoint
The relative strength index is an indicator used to gauge overbought and oversold conditions, while the MACD measures trend strength and trend changes. A positive divergence occurs when the asset’s price hits a new cyclical low while the RSI and/or MACD begins to climb, indicating an impending bullish shift in momentum.

DXY’s price chart with the RSI in the second pane and MACD in the third pane. The trendline on the MACD represents bullish divergence. (QCP Capital) (QCP Capital)


