
Cryptocurrency analysts have announced the critical trading levels for Polygon (MATIC), Solana (SOL), Bitcoin (BTC) and these 6 coins in their recent technical analysis! Here are the details…
Experts have announced the critical trading levels for MATIC, DOT, SOL, BTC and these 6 coins!
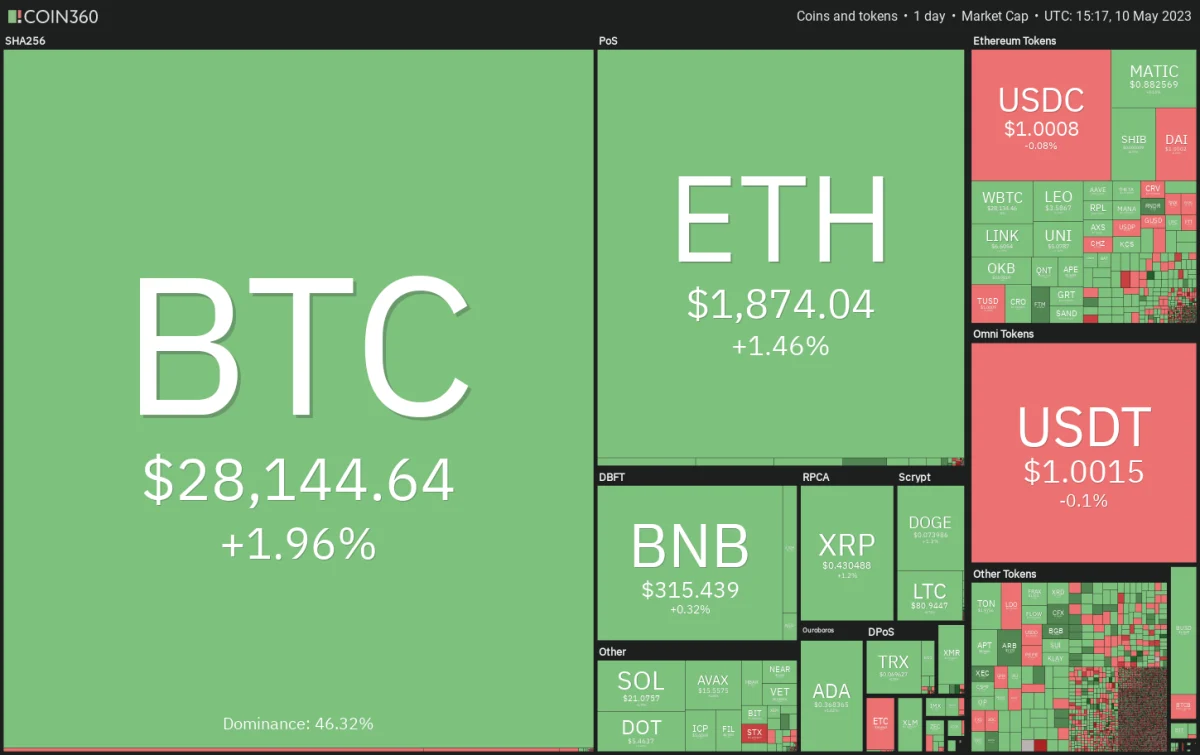
The United States consumer price index (CPI) rose 4.9% year-on-year, slightly below the 5% forecast. CPI increased by 0.4% on a monthly basis in April, in line with expectations. While inflation remains stubbornly above the Federal Reserve’s 2% target, investors expect it to be relieved by the slower pace of growth. This shows that the Fed’s rate hikes are effective and further rate hikes may not be necessary. If the Fed starts cutting interest rates as the FedWatch Tool predicts, this could be positive for risky assets like stocks and cryptocurrencies. However, Bitcoin responded positively to the CPI data and broke above $28,000 on May 10.
While the downside may seem limited, the bulls may not be easy at higher levels due to the high risk of recession and the possibility of a re-explosion of the banking crisis. This can cause price to get stuck in a range, which can serve as a base for the next leg of the rally if or when it does.
Bitcoin (BTC) price analysis
Bitcoin sank below the moving averages on May 7 and broke down to the support line of the symmetrical triangle formation on May 8. The bulls are trying to defend this level strongly, but the recovery may face challenges at higher levels.
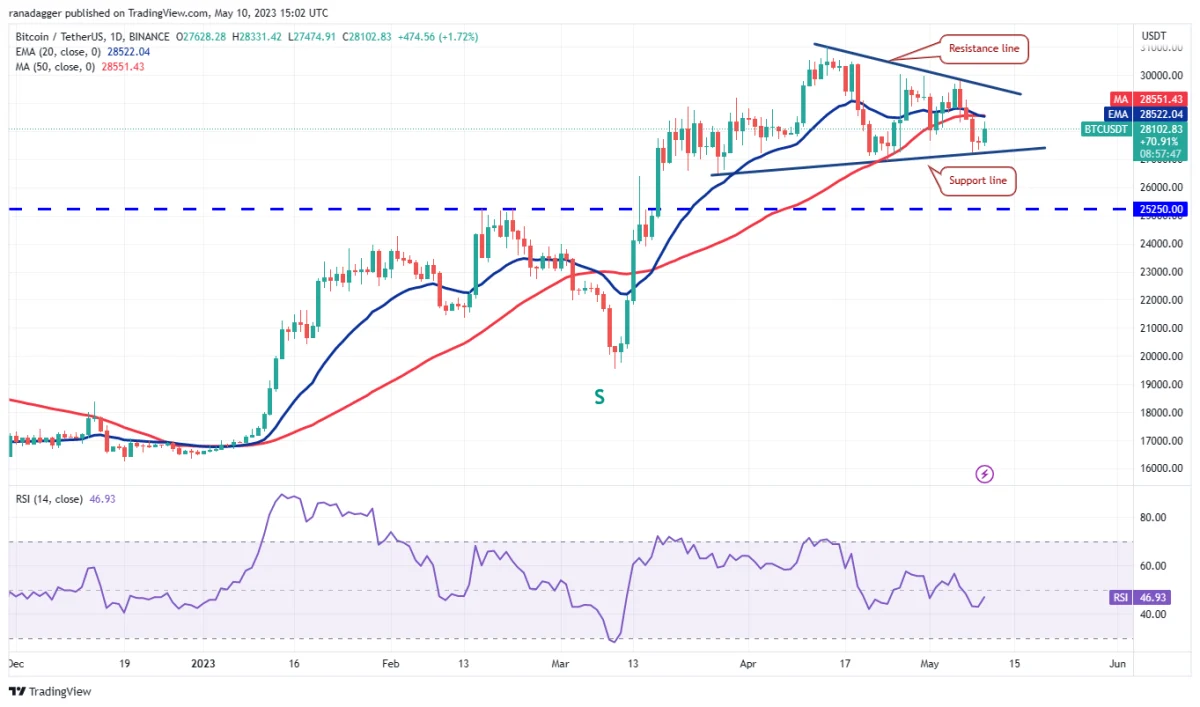
According to experts, the bears will try to aggressively defend the area between the moving averages and the resistance line. If the price declines and breaks below the support line, the BTC/USDT pair could slide to the $25,250 breakout level. This is an important level to consider because if it breaks, the selling could intensify and the BTC price could drop to the psychologically important $20,000 level. Conversely, if the bulls push the price above the resistance line, it will indicate that the corrective phase may be over. The pair could first rally to $30,000 and then attempt to climb up to $32,400.
Ethereum (ETH) price analysis
Ethereum has been stuck between the 20-day exponential moving average (EMA) at $1,887 and the support line for the past two days, but trading in this narrow range is unlikely to continue for long.
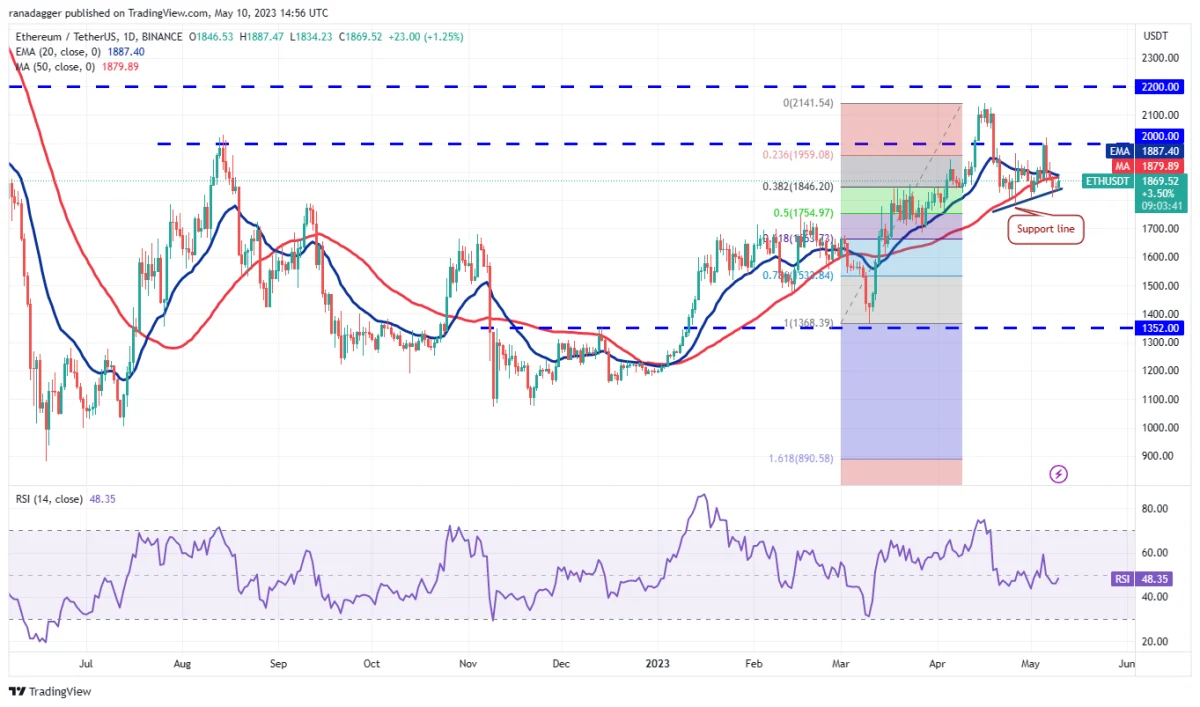
If the price breaks through the hurdle on the moving averages, it will signal strong buying at the lower levels. The ETH/USDT pair will then attempt to climb the psychological resistance of $2,000. The bears are expected to fiercely defend this level, but if the bulls break this hurdle, ETH price could rise to $2,200. On the contrary, if the price fails to stay above the moving averages, it will indicate that the bears are attacking every small rally. A break below the support line could start a downward move that could reach the 61.8% Fibonacci retracement level of $1,663.
Binance Coin (BNB) price analysis
Binance Coin (BNB) price broke below the triangle on May 7, signaling that uncertainty has been resolved in favor of the bears.
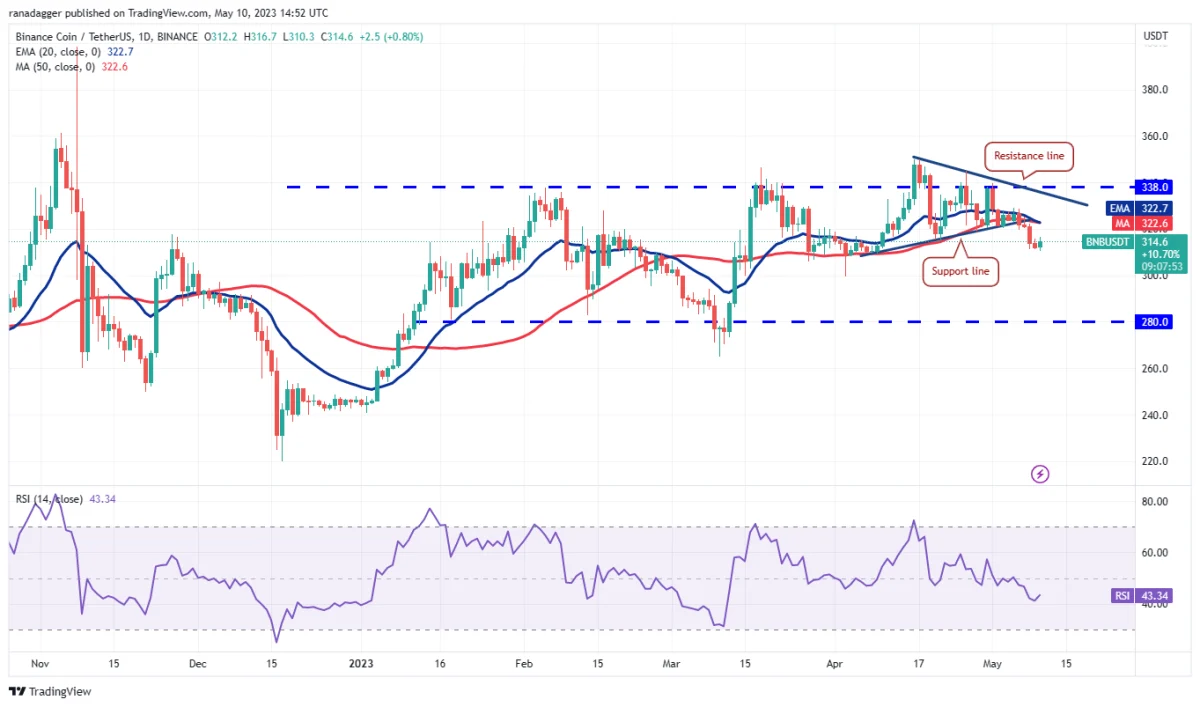
Selling intensified on May 8 and the BNB/USDT pair started its journey towards the psychological support of $300. This level could attract buying, which could start a recovery towards the 20-day EMA ($322). If the price turns down from this level, it will increase the probability of a drop below $300. The next level of support is $280. If the bulls want to avoid the decline, they will have to push the BNB price above the 20-day EMA. If they are successful, the pair could reach the overhead resistance of $338.
Ripple (XRP) price analysis
Ripple (XRP) broke below the $0.43 support on May 8, but the long tail on the candlestick indicates strong buying at the lower levels.

The XRP/USDT pair is struggling near the $0.43 breakdown level. While the bears are trying to turn this level into resistance, the bulls are trying to push the price above this level. If XRP price turns down from the current level and dips below $0.40, the bearish momentum could increase and the pair could drop to $0.36. This negative view will be invalidated in the short term if the bulls push the price above the resistance line.
Cardano (ADA) price analysis
Cardano (ADA) dropped below the $0.37 support on May 8, showing the bears trying to take control.
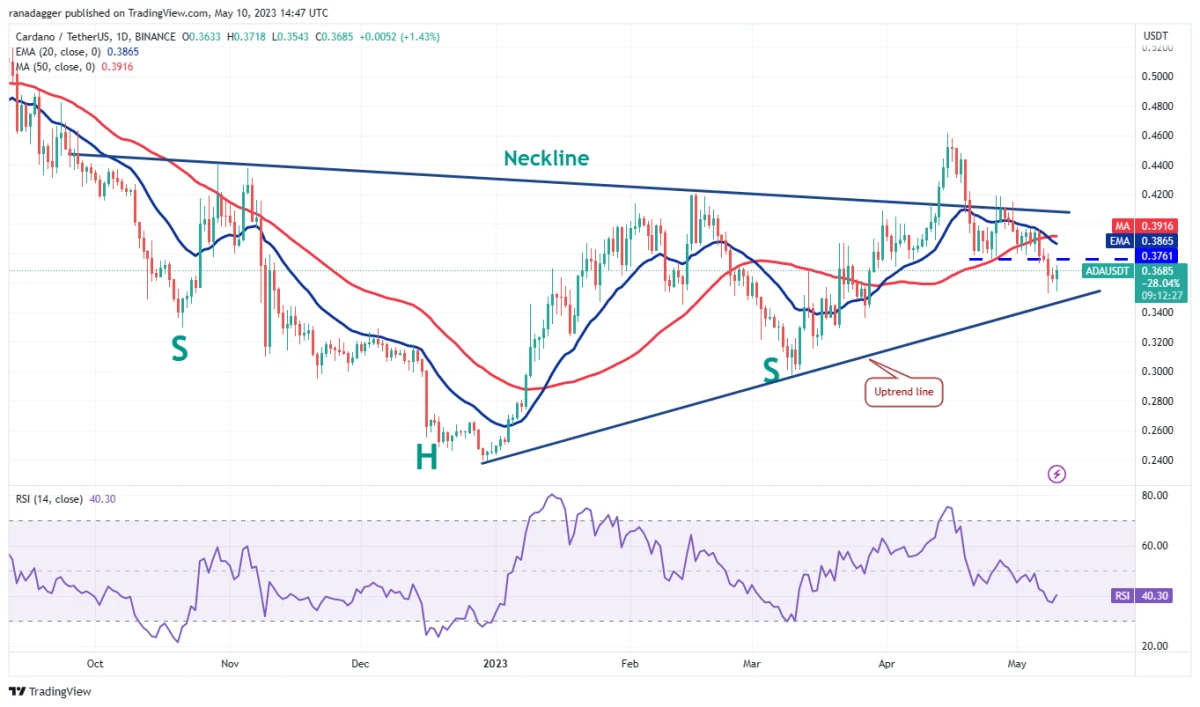
The bulls are attempting to stop the decline near the uptrend line, but they will likely face stiff resistance at the $0.37 breakout level. If the price turns down from this level, it will show that the bears have turned $0.37 into resistance. This will increase the probability of a break below the uptrend line. The ADA/USDT pair could then start lower to $0.33 and then to $0.30. The first sign of strength would be a breakout and close above the moving averages. This would open the doors for a rally to $0.42.
Dogecoin (DOGE) price analysis
Dogecoin (DOGE) continued its downward journey and touched the solid $0.07 support level on May 8. The bulls are trying to make a jump from this level.
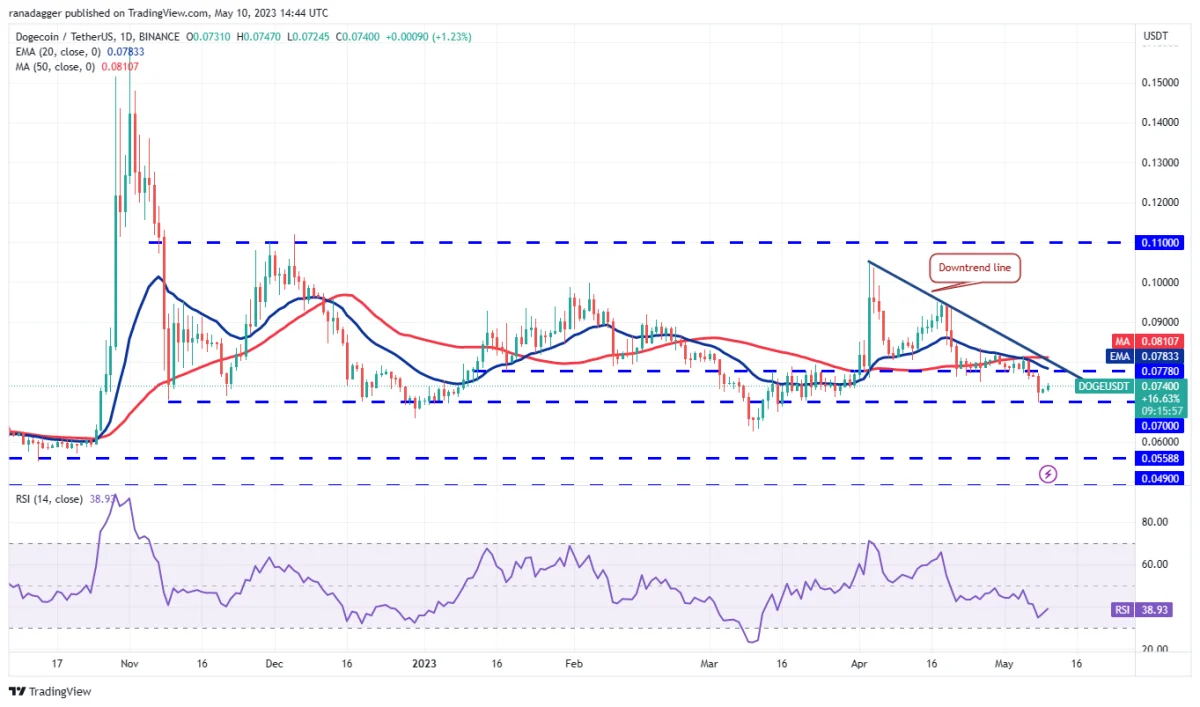
The relief rally is likely to reach the downtrend line where the bears are expected to make a strong defense. If the price turns down from this level, the bears will again try to push the DOGE/USDT pair below the $0.07 support level. If they are successful, the pair could drop to $0.06, which is not a major support. If this level is also exceeded, the pair can drop to $0.05. Conversely, if buyers push the price above the downtrend line, it will signal the start of a stronger recovery. DOGE’s price could then rise to the overhead resistance area of $0.10 to $0.11.
Polygon (MATIC) price analysis
Polygon (MATIC) dropped below the vital support level of $0.94 on May 8, showing that the bears are in control.
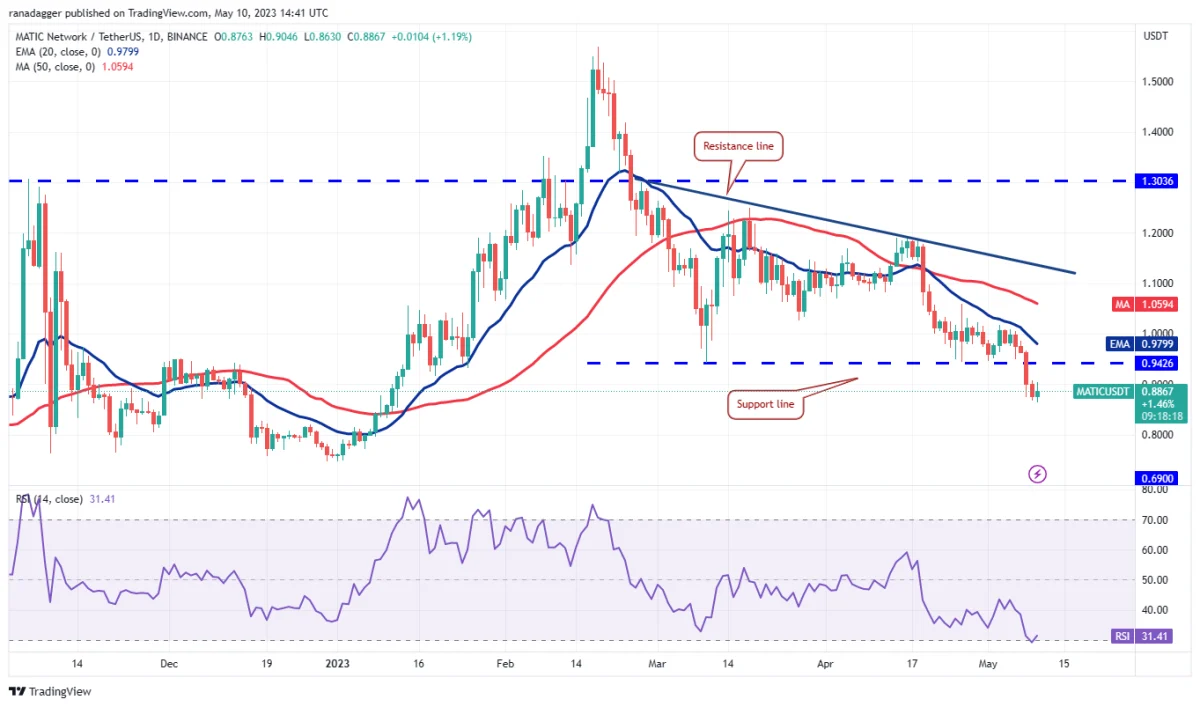
The sharp decline over the past few days has drawn the relative strength index (RSI) into oversold territory, suggesting that a recovery is possible. Sellers will try to jump into any relief rally and keep the price below the $0.94 level. If they do, the MATIC/USDT pair could start its journey towards the strong support level of $0.69. Conversely, a break and close above the 20-day EMA ($0.98) will indicate lower levels attract solid buying. This could trap a few aggressive bears and push MATIC price towards the resistance line.
Solana (SOL) price analysis
Solana (SOL) broke from the downtrend line on May 6 and dropped to the strong support level of $19.85 on May 8.
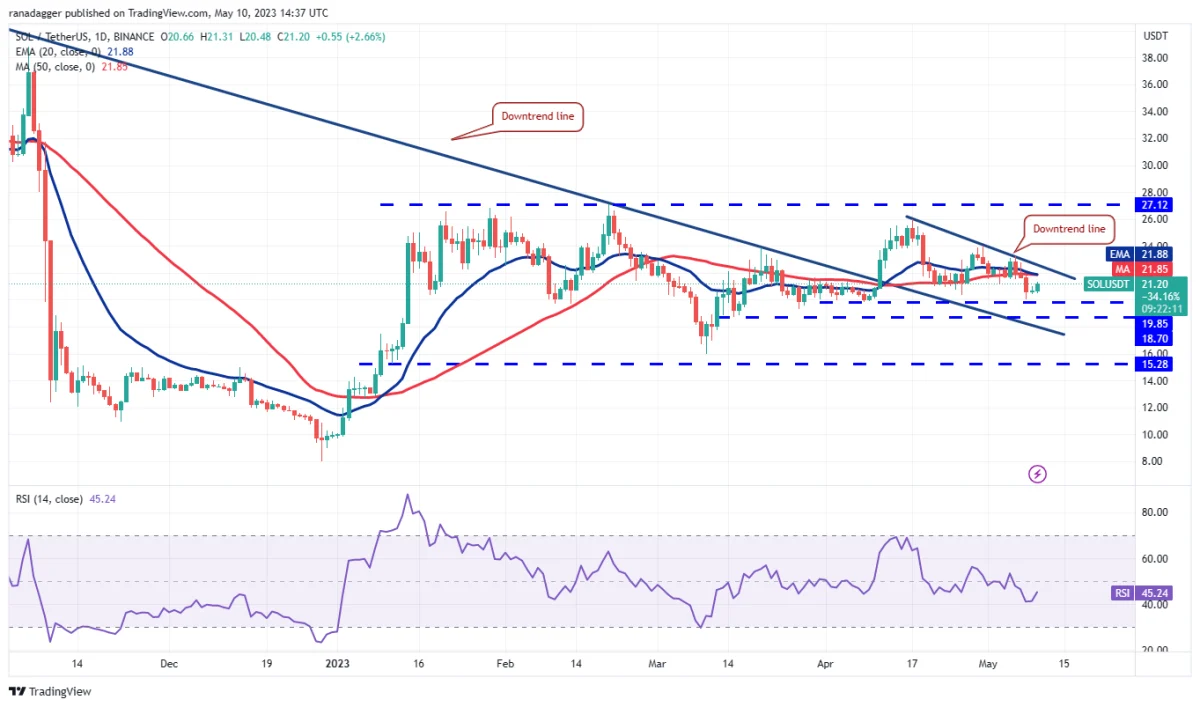
The bulls are trying to start a recovery, but the recovery lacks credibility. If Solana’s price declines from the current level and dips below $19.85, the SOL/USDT pair could slide as low as $18.70. This level can act as strong support again. If the bulls want to avoid the downtrend, they will have to push the price above the downtrend line quickly. If they do, the price of SOL could rally to $24 and then the overhead resistance at $27.12.
Polkadot (DOT) price analysis
The bulls are attempting to hold the strong $5.15 support level as seen from the long tail on Polkadot’s May 8 candlestick.
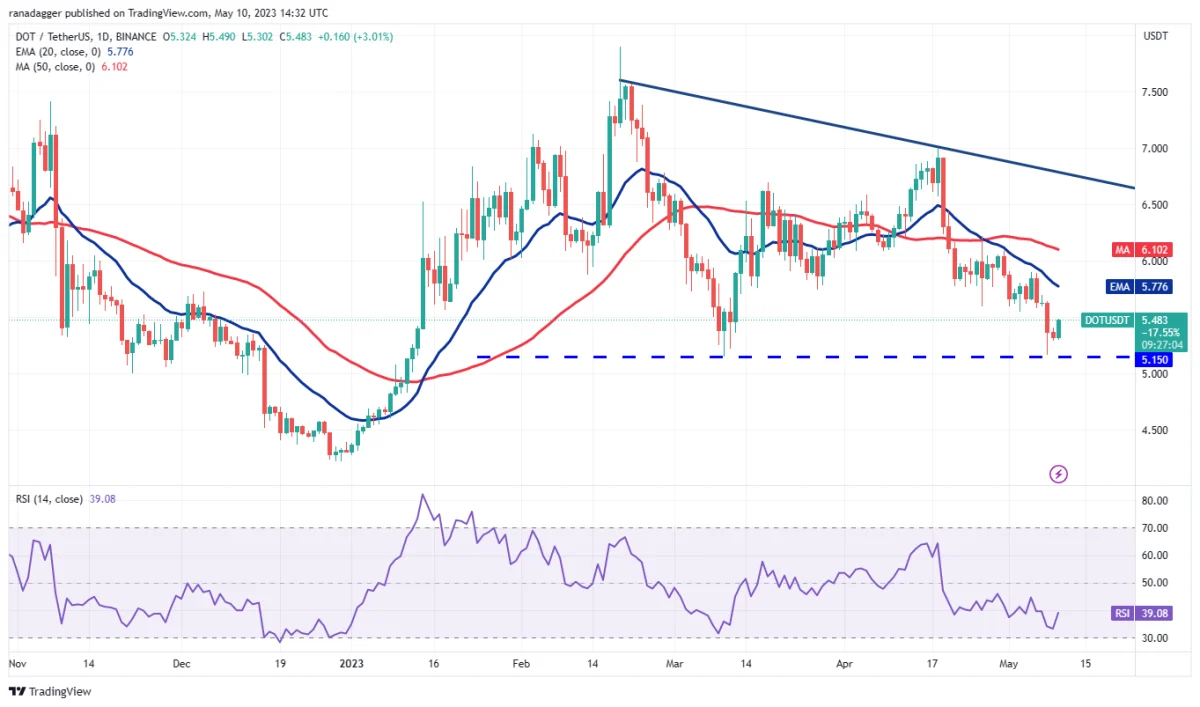
The recovery is likely to face stiff resistance at the 20-day EMA ($5.77) as the bears are holding this level strongly. If the price turns down from the current level or the 20-day EMA, the bears will make another attempt to sink the DOT/USDT pair below $5.15. If they can do this, Polkadot’s price risks falling as low as $4.50. On the contrary, if the relief rally pierces the 20-day EMA, the price of the DOT could rise from $6.10 to the 50-day simple moving average (SMA) and then reach the downtrend line. A break and close above this level will indicate that the bulls are in a reversal.
Litecoin (LTC) price analysis
Litecoin (LTC) recovered from the key support level of $75 on May 8, showing that the bulls are trying to stop the decline at this level.
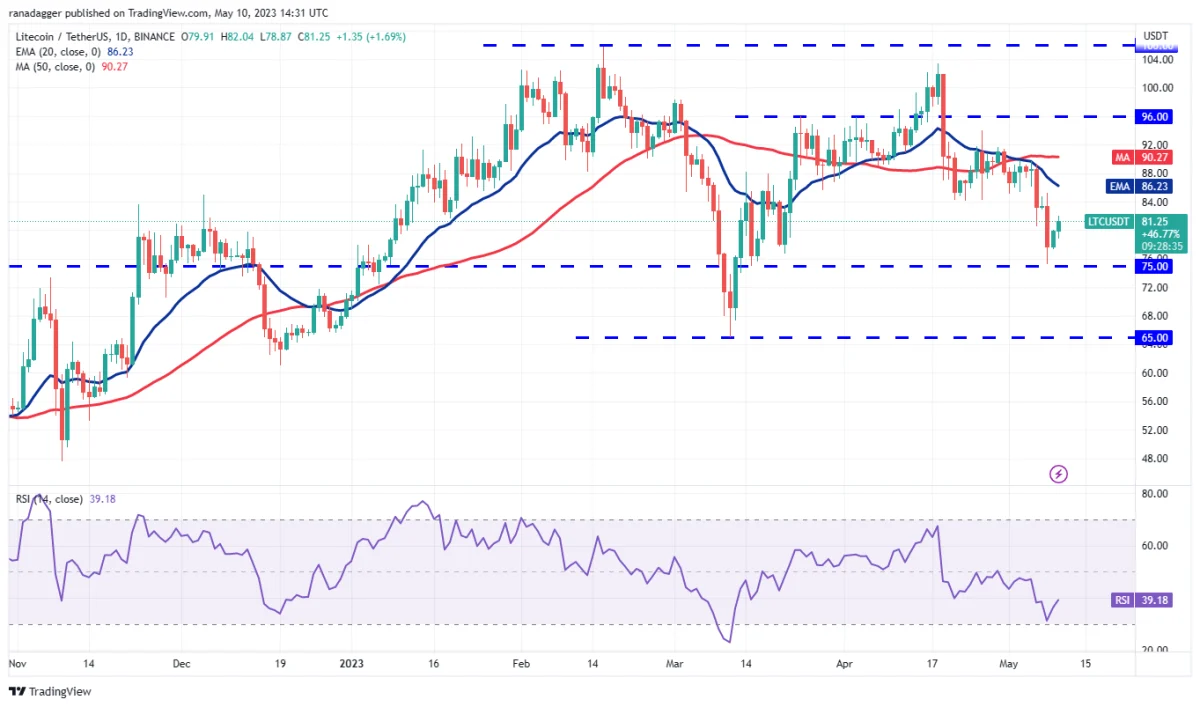
The falling 20-day EMA ($86) and the RSI in the negative territory suggest the bears are in control. Any attempt to recover is likely to face selling at the 20-day EMA. If Litecoin’s price turns down from this level, the probability of a drop below $75 will increase. If this happens, the LTC/USDT pair could drop as low as $65. Contrary to this assumption, if the bulls push the price of LTC above the 20-day EMA, it will indicate that the bearish pressure has subsided. The pair could recover as high as the 50-day SMA ($90) and then rise towards $96.