
Cryptocurrency experts recently announced the trading levels for DOGE, SOL, MATIC and 5 Coins in their analysis! Here are the details…
The critical trading levels for DOGE, SOL, MATIC and these 5 coins have been announced!
cryptocoin.com As we have reported, the debt ceiling negotiations in the United States keep investors on their toes. Jamie Dimon, CEO of JPMorgan Chase, told Bloomberg on May 11 that a possible default by the U.S. government could cause panic in the stock markets, leading to increased volatility.
The next big question plaguing crypto investors is how Bitcoin will react to such an event. Bloomberg’s latest Markets Live Pulse survey shows that Bitcoin could become the third most preferred asset class after gold and US Treasuries if the US government fails to prevent a debt default.
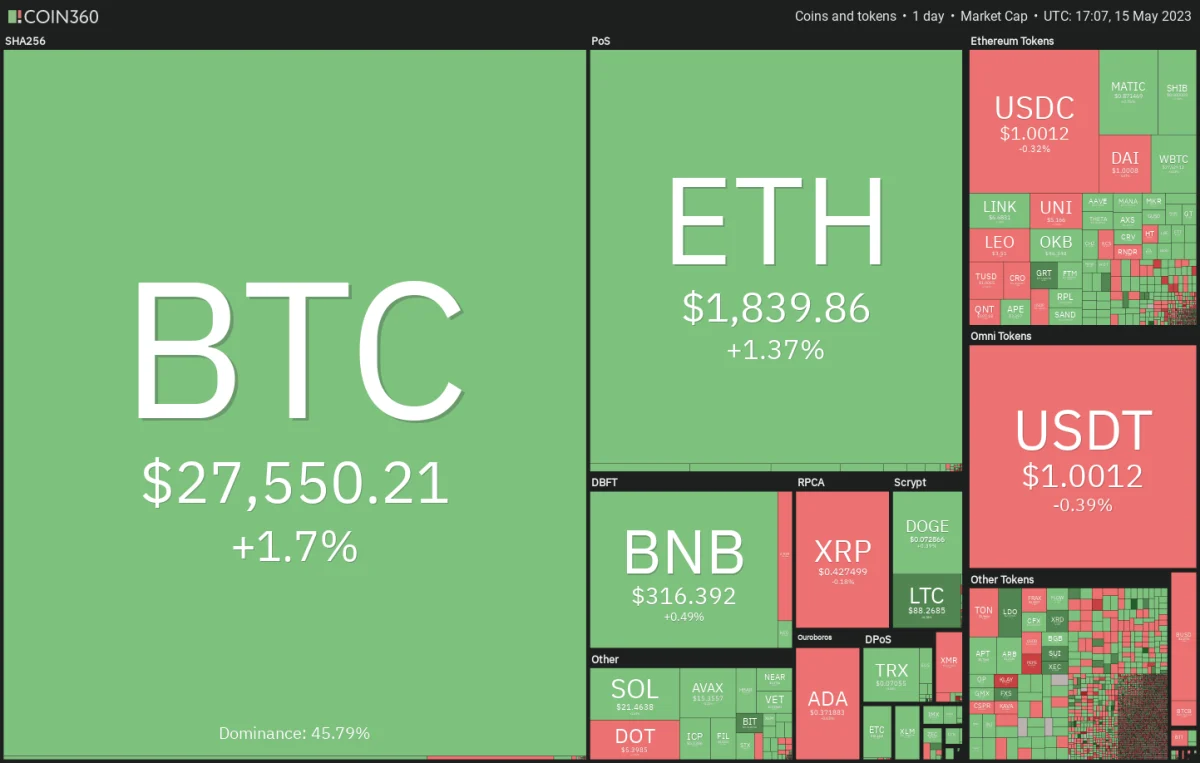
Billionaire fund manager Paul Tudor Jones told CNBC that he holds his Bitcoin and will always keep a portion of his portfolio in Bitcoin. So what do the experts think? What are the critical levels?
S&P 500 Index
The S&P 500 Index has been trading at 4.118 for the past few days, close to the 20-day exponential moving average (EMA). This indicates that there will be a tough fight for supremacy between the bulls and bears in the near term.
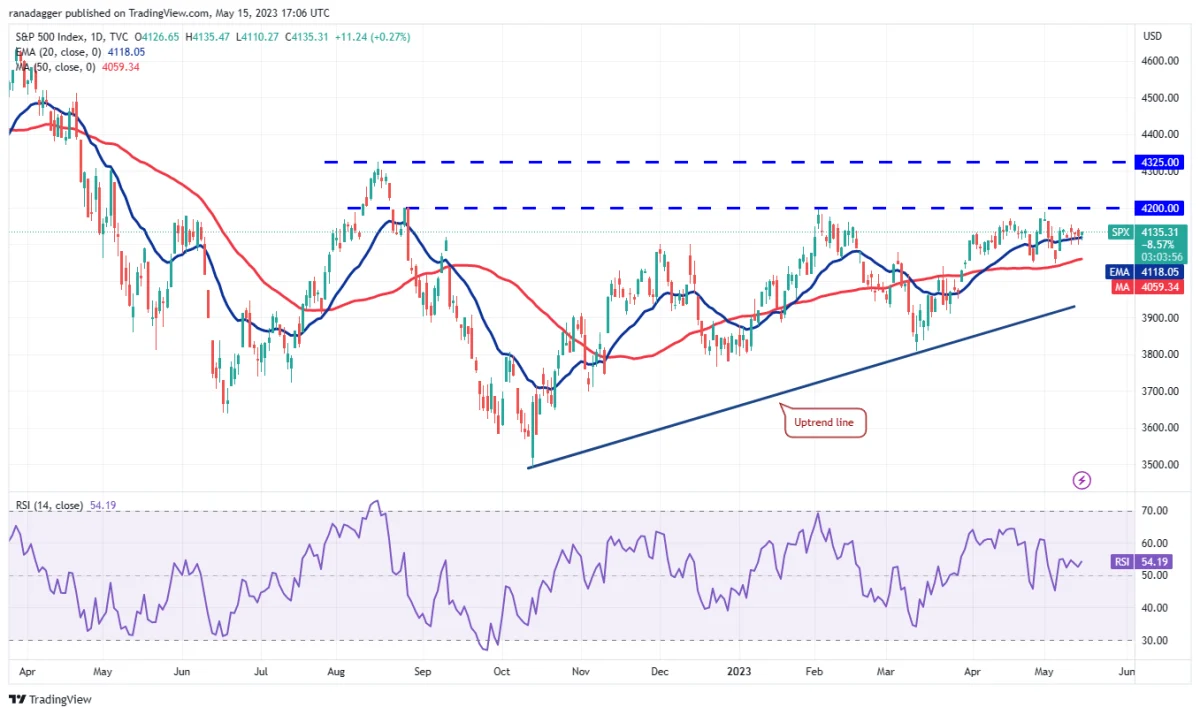
The gradually rising 20-day EMA and the relative strength index (RSI) near the midpoint point to range-bound action in the short term. The index could oscillate between the overhead resistance of 4,200 and the 50-day simple moving average (SMA) of 4,059 for a few more days. A break and close below the 50-day level of the SMA could push the price towards the uptrend line. If this support is broken, the index can regress to 3,800. On the upside, the bulls will need to clear the hurdle at 4,200. The index could then rise to 4.325, where the bears will pose a strong challenge again. During the correction from this level, buyers turning 4,200 to support will increase the probability of a rally above 4,325.
US dollar index
After a few days of failing, the bulls finally managed to push and sustain the US Dollar Index (DXY) above the 20-day EMA (101.88) on May 11.
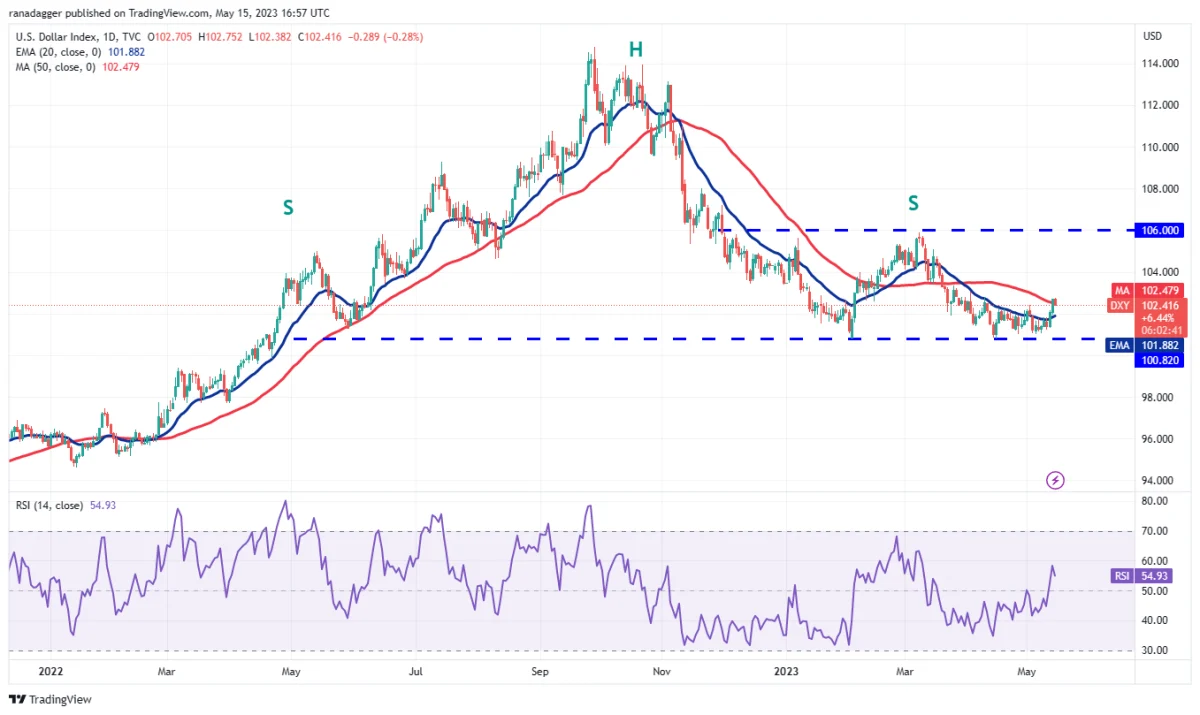
The bulls continued their buying and broke the overall barriers at the 50-day SMA (102.47) on May 12. The 20-day EMA has gradually started to rise and the RSI has jumped into the positive zone, showing that the bulls have a slight advantage. The index could climb as high as 103.50 in the short term, where it is likely to face selling again by the bears. Conversely, if the price drops and breaks below the 20-day EMA, it will indicate that a break above the 50-day SMA could be a bull trap. The index may then retest vital support at 100.82. A break and close below this level will complete a bearish head and shoulders (H&S) pattern that could initiate a downside move towards 97.50.
Bitcoin (BTC) price analysis
The bulls are trying to push Bitcoin back into the symmetrical triangle pattern, which signals strong buys at the lower levels.
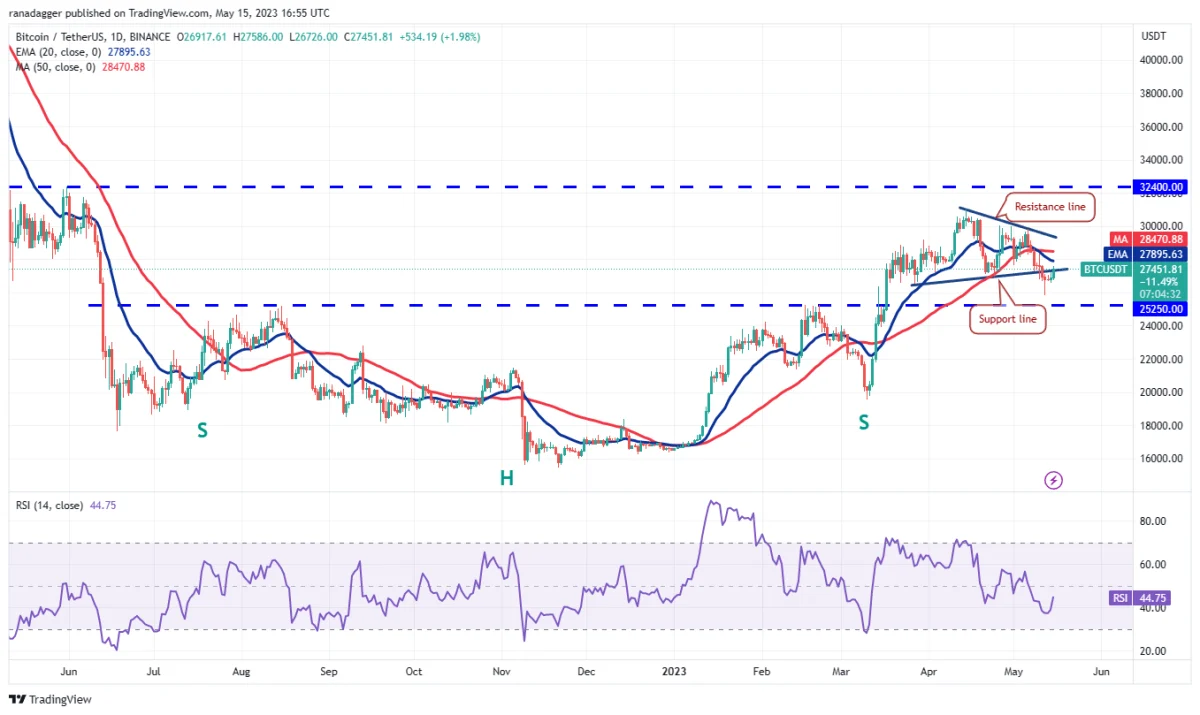 BTC daily price analysis
The relief rally is likely to face strong selling at the moving averages and again at the resistance line of the triangle. If the price turns down from the overhead resistance, the bears will make another attempt to drop the BTC/USDT pair to $25,250. This is an important level to consider because if it breaks, selling could intensify and the pair could drop to $20,000. On the upside, the bulls will need to break through the resistance line to indicate the start of a new upward move. The pair could rise to $31,000 first and then attempt to climb above $32,400.
Ethereum (ETH) price analysis
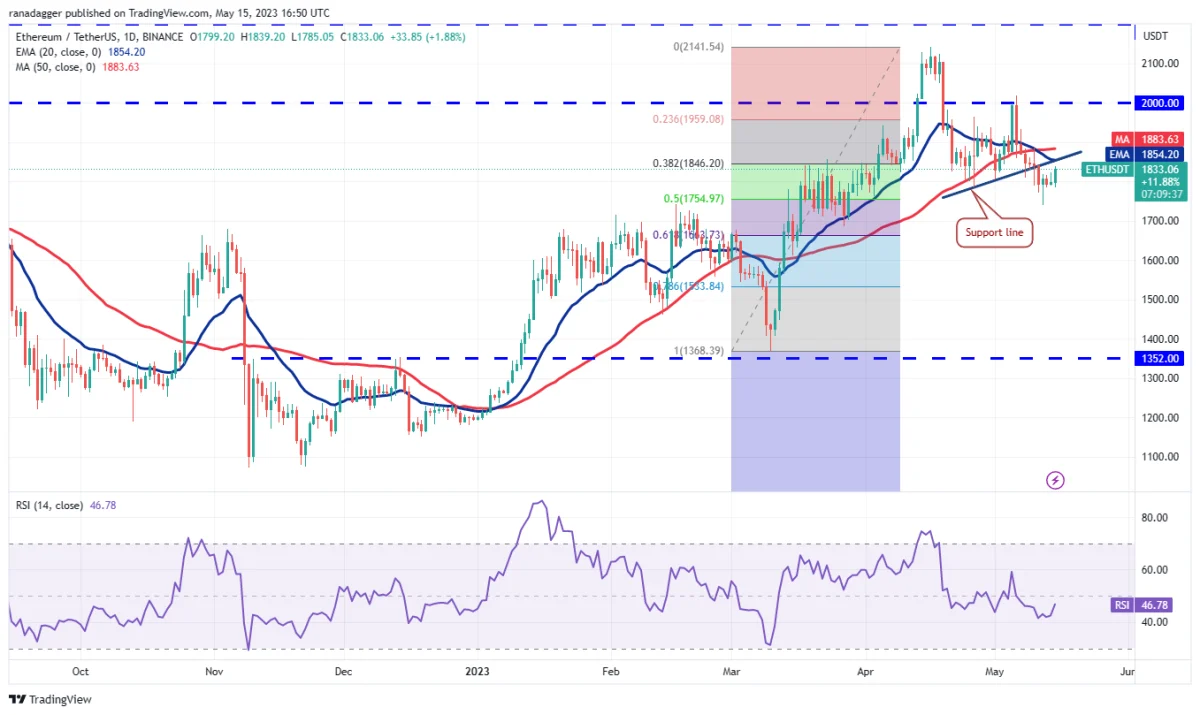
Ethereum (ETH) turned up from the 50% Fibonacci retracement level of $1,754 on May 12 and after a few days of consolidation, the bulls took the price to the 20-day EMA ($1.854).
 ETH daily price analysis
The bears will vigorously try to protect the support line and turn it into resistance. If they can achieve this, it will signal that higher levels are attracting sellers. The ETH/USDT pair could later retest the immediate support at $1,740. A break and close below this level could push the price towards the 61.8% Fibonacci retracement level of $1,663. If the bulls want to avoid a decline, they will need to push the price above the 50-day SMA ($1.883). The pair could then rise to the psychologically important $2,000 level.
Binance Coin (BNB) price analysis
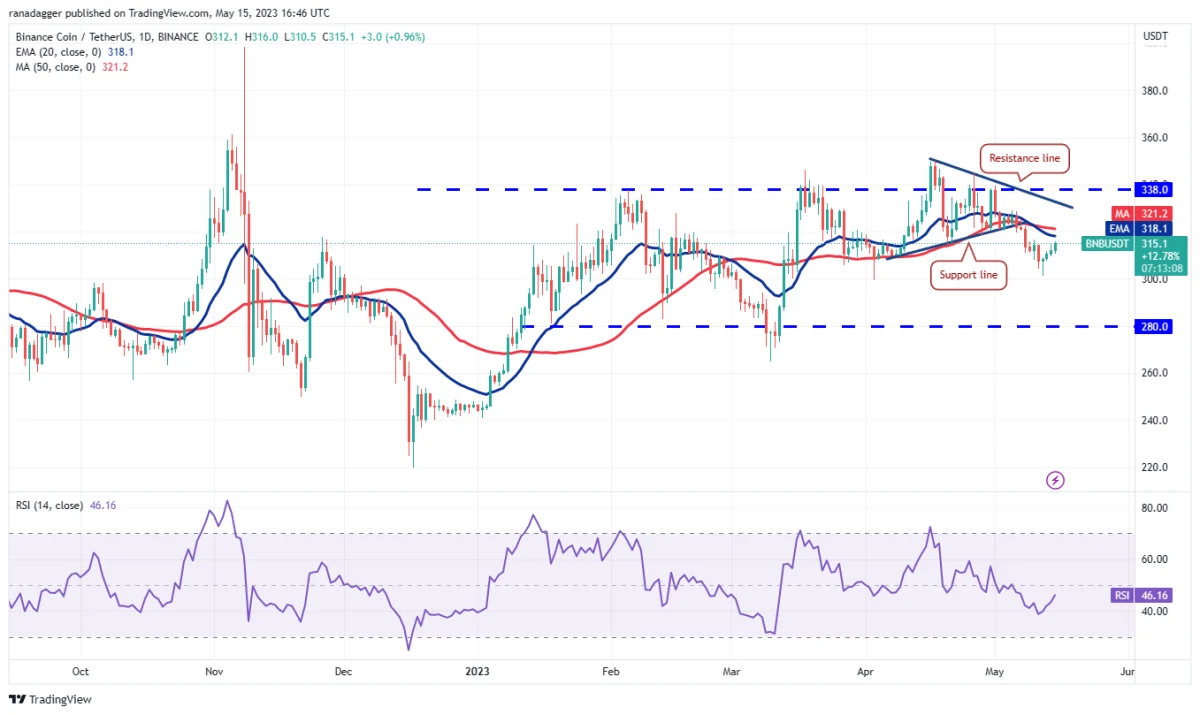
The bulls pushed BNB to the moving averages, proving strong support at the $300 level.
 BNB daily price analysis
A break and close above the moving averages will pave the way for a potential rise to the overhead resistance of $338. This level could be a strong barrier, but if the bulls overcome it, the BNB/USDT pair could rise to $350. Alternatively, if the price turns down from the moving averages, it will indicate that the bears are not giving up. Then they will try to push the price below $300 again. If they do, the pair could slide to the next support at $280.
Ripple (XRP) price analysis
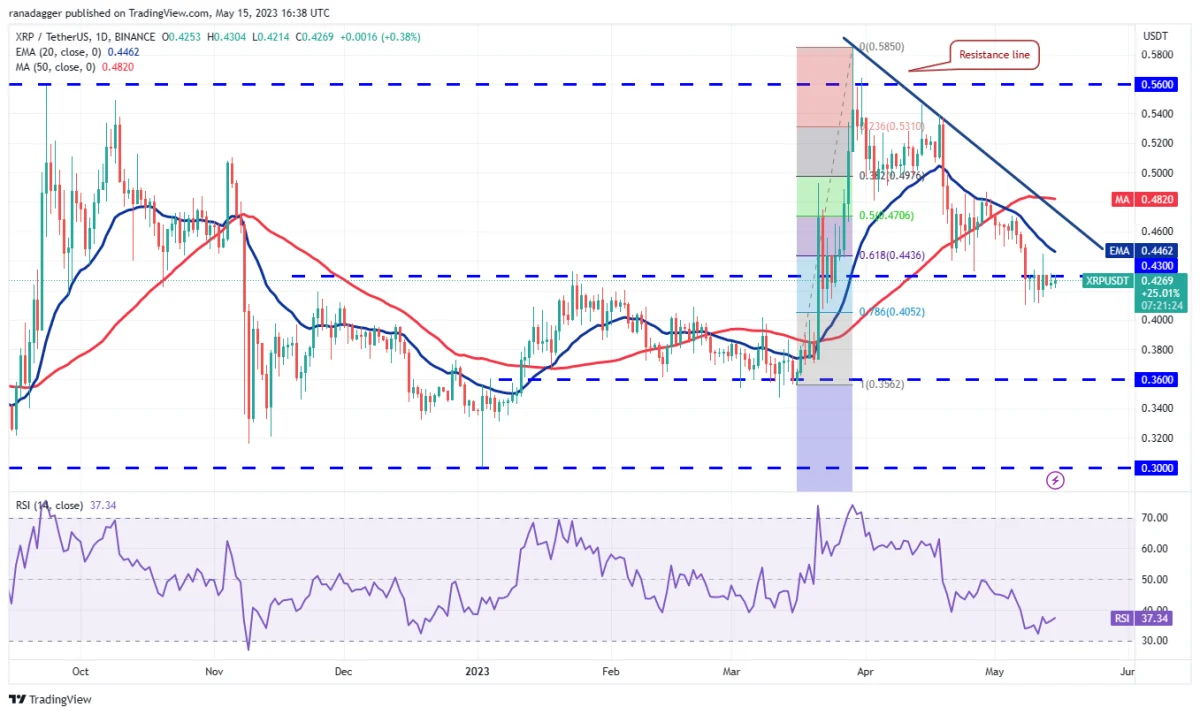
Ripple (XRP) has been trading below $0.43 for the past few days, but a minor positive point in the bulls’ favor is that the bears have not let the bears prolong the decline any further.
 XRP daily price analysis
The bulls will try to take advantage of the situation and push the price above $0.43. This could extend the recovery to the resistance line where the bears will try to defend the level again. The bulls will need to break through this hurdle to start a rally to $0.48 and then $0.54. Another possibility is for the price to bounce back from the current level and slide below $0.40. This will signal the resumption of the downward move. The XRP/USDT pair could then fall as low as $0.36.
Cardano (ADA) price analysis
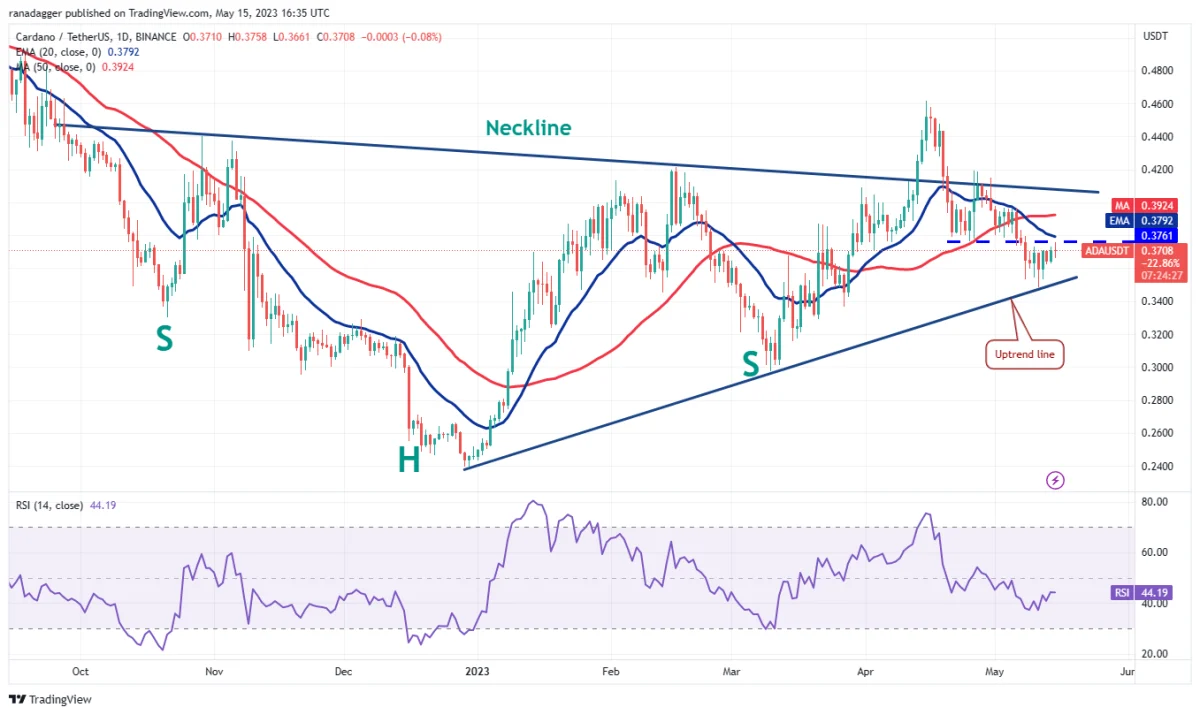
Cardano’s recovery has reached the 20-day EMA ($0.37), which is an important level to consider in the near term.
 ADA daily price analysis
If buyers push the price above the 20-day EMA, this will indicate that sentiment remains positive and traders are buying on the dips. The ADA/USDT pair could then move higher towards the neckline of the inverted H&S pattern. If the price turns down from the neckline, it will indicate that the pair may oscillate between the neckline and the uptrend line for a few more days. A break and close below the uptrend line will indicate that the bears are taking control. The pair could then decline as low as $0.30.
Dogecoin (DOGE) price analysis
The bulls have successfully defended the $0.07 support level in Dogecoin for the past few days, which indicates solid demand at the lower levels.
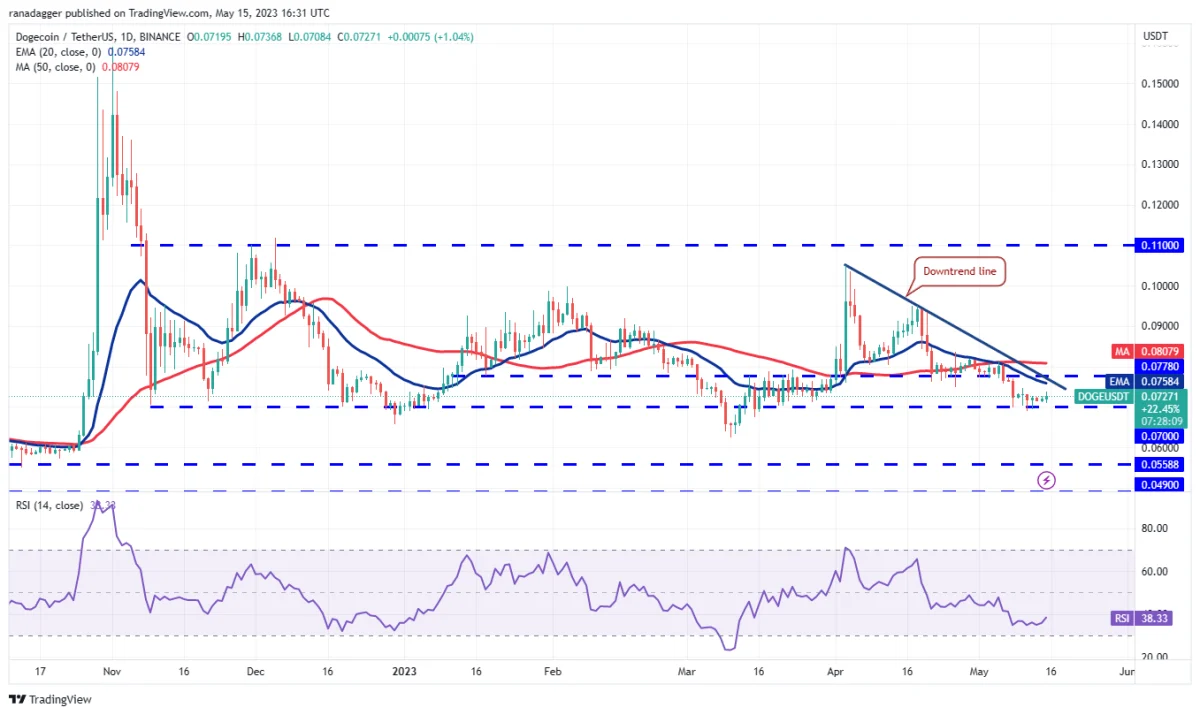 DOGE daily price analysis
The relief rally is likely to face resistance near the moving averages. If the price turns down from overhead resistance, it will indicate demand drying up at higher levels. This will encourage the bears and they can try to push the DOGE/USDT pair back below $0.07. If they do, the pair could drop as low as $0.06. If the bulls want to avoid a drop below $0.07, they will need to push the price above the 50-day SMA ($0.08). For DOGE, the pair could later rise to the $0.10 to $0.11 resistance zone.
Solana (SOL) price analysis
Solana’s recovery from strong support at $19.85 is approaching the downtrend line. This is likely to pose a strong hurdle for the bulls in the near term.
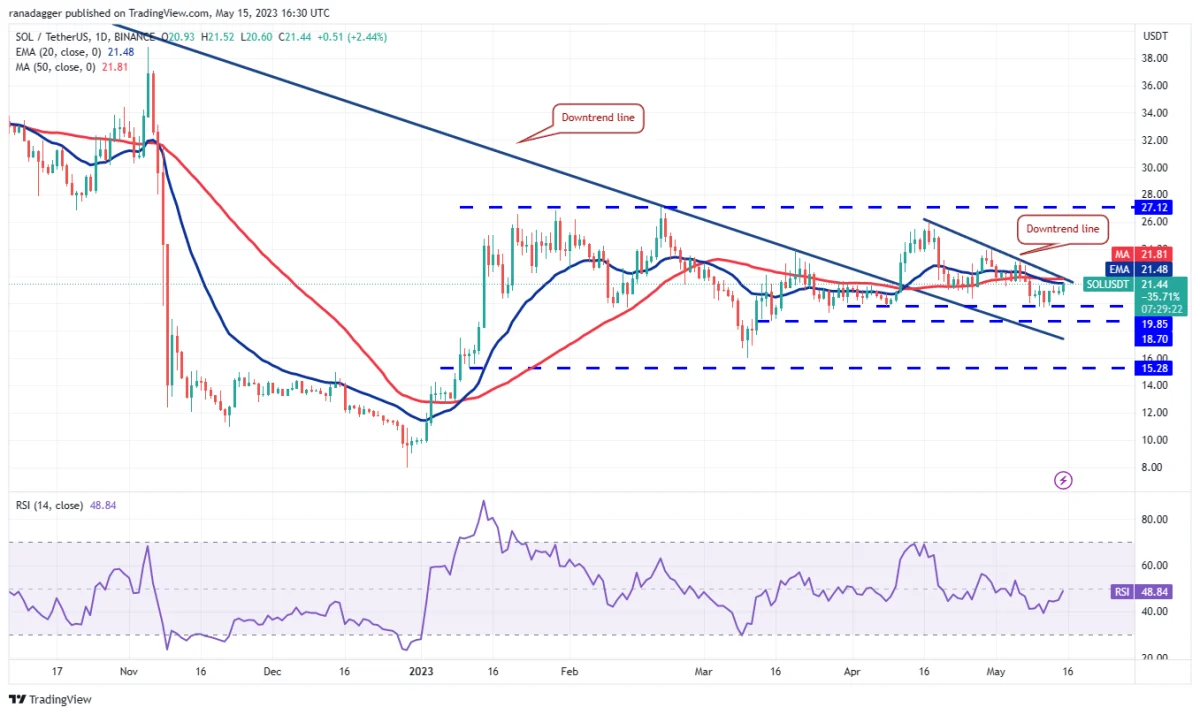 SOL daily price analysis
The moving averages are flattening and the RSI is near the midpoint, indicating that selling pressure may ease. If the buyers push the price above the downtrend line, the SOL/USDT pair will attempt to rise to $24. On the contrary, if the price turns down from the downtrend line once again, it will indicate that the bears are not in the mood for relief. In this case, the pair could be stuck between the downtrend line and $19.85 for a while.
Polygon (MATIC) price analysis
Polygon (MATIC) is attempting to start a rebound that is likely to reach the $0.94 breakout level. Bears are expected to make a strong defense at this level.
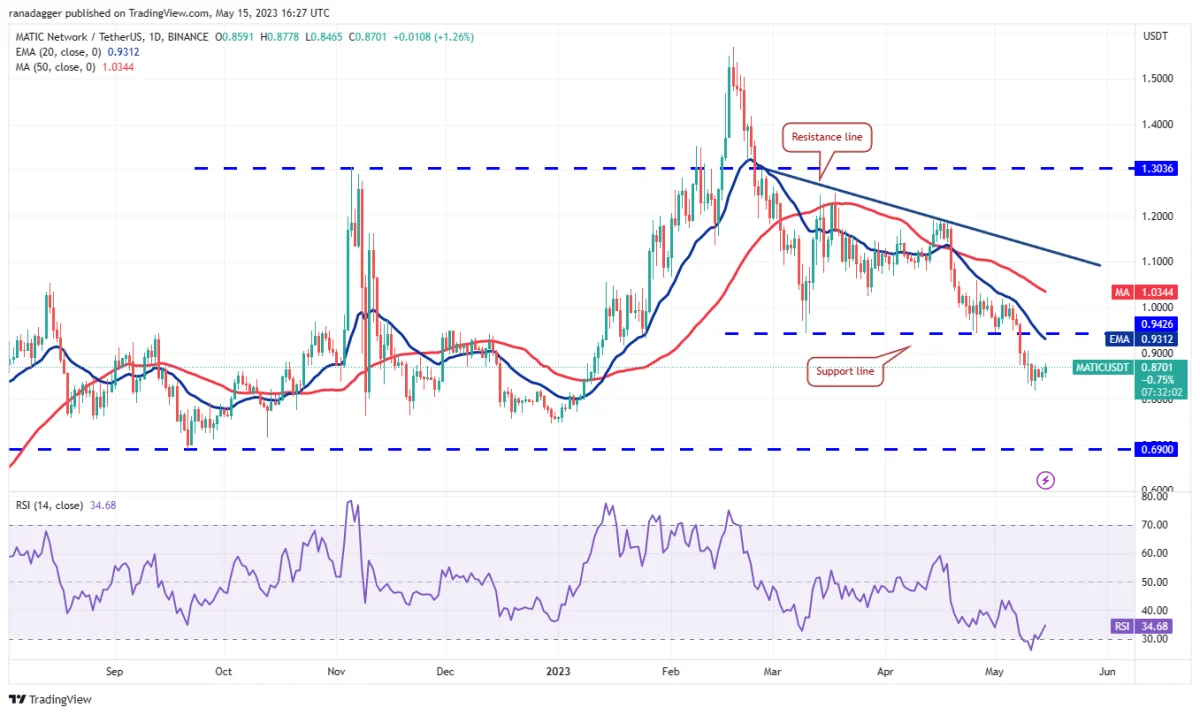 MATIC daily price analysis
If the price reverses below $0.94, it will show that the bears have turned this level into resistance. They will then try to further strengthen their position by pulling the MATIC/USDT pair below $0.81. If they are successful, it will open the doors for a potential drop to $0.69. Contrary to this assumption, if buyers push the price above $0.94, it will signal strong buy lower levels. The pair could rise to the 50-day SMA ($1.03) first and then attempt a rally towards the resistance line.