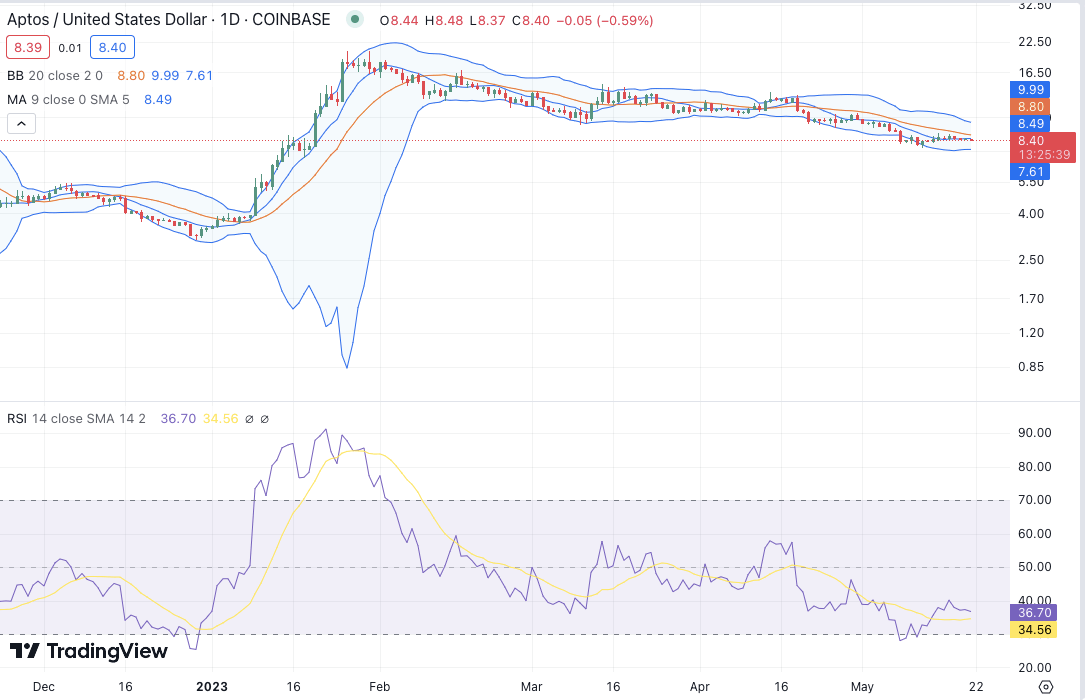
The bearish momentum on Aptos brought the price up to the $8.5 band.
What is the reason for the drop in Aptos (APT), what are the support and resistance levels? We have discussed the support and resistance levels in Aptos in this article.
Aptos (APT) Price Analysis
When we first examine the daily chart of Aptos, we see that it is experiencing a bearish momentum. With the downward momentum, the price came to the $ 8.5 band in Aptos.

Aptos price analysis on the daily chart shows signs of a bearish divergence. There was a recurring drop in the value of the token, and today its value has dropped 0.50% over the past 24 hours to as low as $8.52.
The current price is below the moving average (MA), which is set at $8.49. The Bollinger Bands Indicator on the 1-day price chart points to the following values: the upper value is $9.99 and the lower value is $7.61, which indicates that the coin is trading in the normal range in this market. The Relative Strength Index (RSI) is set at 36.70, which indicates that the coin is still under bearish pressure as it has failed to rise above the 50 mark on a regular basis.
Aptos’ overall technical analysis shows that there is no strong demand for the cryptocurrency and market sentiment is weak. The bearish trend in price points to strong control by the bears, which could lead to further declines.


