A wick to $28,000 on the Bitcoin (BTC) chart ignites hopes for several-week highs, but remains cautious about weak bid book liquidity.
Bitcoin volume rises with more expectation
Bitcoin (BTC) has rebounded from a massive drop in the May 26 Wall Street opening as the market rapidly exhausted buying support. Data from TradingView showed that BTC dropped to $28,000 on Bitstamp. This is the lowest level since May 12 and the Terra (LUNA) crash.
Progress has already accelerated downwards during the day resulting in a liquidity grab that sent 24-hour BTC liquidations to $117M.
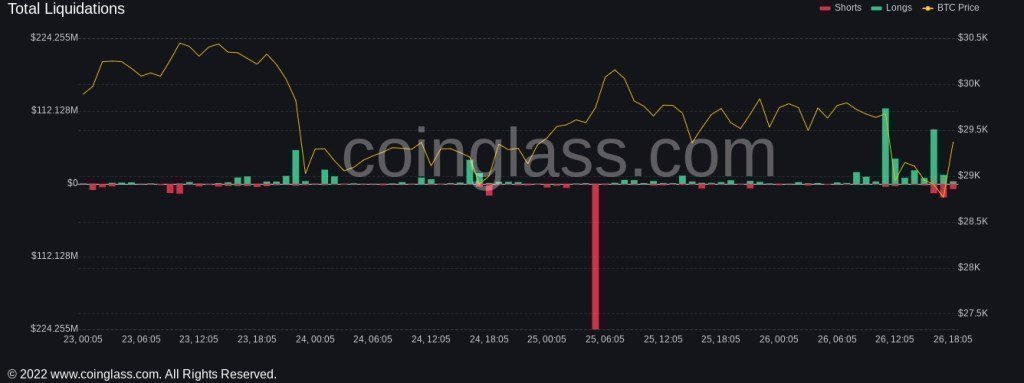 BTC liquidation chart / Source: Coinglass
 With a subsequent bounce, Bitcoin managed to break above $29,000, where it was trading at the time of writing. According to popular analyst Michaël van de Poppe, the raid to fill the bids was enough to provide some fresh upside.
https://twitter.com/CryptoMichNL/status/152982294621570048
Analyst, current targets for BTC ($32,800 and $35,000) He adds that it is still in effect.
“A future downturn may face less resistance”
Meanwhile, on-chain monitoring resource Material Indicators, which analyzes quote book data, is considering weak liquidity remaining at lows. taken, he warns that a future decline may meet with less resistance.
“Today we see a lot of Bitcoin liquidity changing hands. An offer wall is appearing everywhere, it is being sucked in,” said Material Indicators, sharing a chart from Binance, explaining the situation:
There are currently no large offer walls and only ~122 million dollars between 28k and 25k dollars . I expect to see more BTC movements on the blockchain.
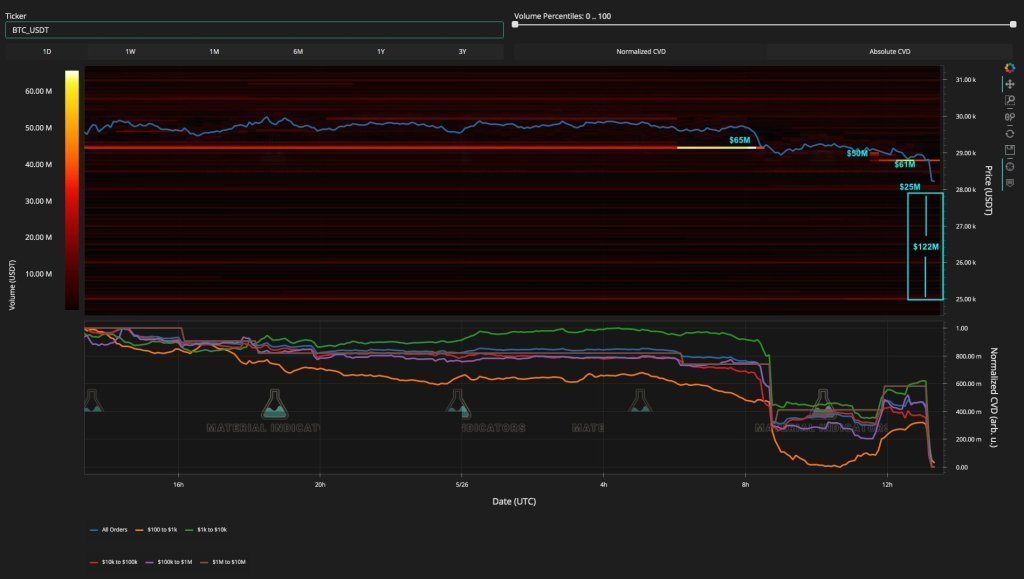 BTC bid book chart (Binance) / Source: Material Indicators
 “The last jump in Bitcoin price will be the last bull trap”
Another analyst, Crypto Capo, who maintains a conservative view on near-term price action, predicts the current bounce will be the ‘last bull trap’ before returning to $25,000 based on bid book performance.
May 26 stood out from other trading days of the week thanks to the volume returning to the BTC markets. As we covered in Kriptokoin.com news, the lack of volume had become a concern for analysts.
Bitcoin’s ‘top chart’ offers hope of recovery
Market commentators seem eager to see signs of a general shift in trend in Bitcoin, taking the network further. For popular analyst Root, these signs came from the behavior of long-term holders (LTHs) during the day.

According to on-chain data, LTHs are eventually slowing down BTC sales, as evidenced by their cost-based leveling. The cost basis refers to the price at which LTH accounts buy BTC in bulk, and when it drops, it reflects the dwindling LTH solution. Commenting on the Twitter thread, Root describes the data as ‘perhaps the most important chart in BTC right now’, saying:
Over the past months, we have had LTH capitulation, as demonstrated by the rapidly falling LTH Cost Basis. A spike is the first sign that LTHs may have stopped capitulating! PS: Early signal, but finally a change in trend!”
The analyst adds that the selling LTH assets are the top BTC buyers and therefore the sales are capitulation for them.


