What about the chart for Bitcoin (BTC), which is showing a weak increase despite showing positive signs in the technical structure?
It has been going down for almost 20 days. bitcoin made a trend break for the second time. Trend breaks usually have a strong increase or decrease. bitcoin The trend break made by ‘s for the second time points to an increase of $ 350. When the first breakdown occurred, there was a larger increase. However, the fact that this increase was fake was a negative critical data for the market. How is the latest situation on the chart for the turbulent Bitcoin?
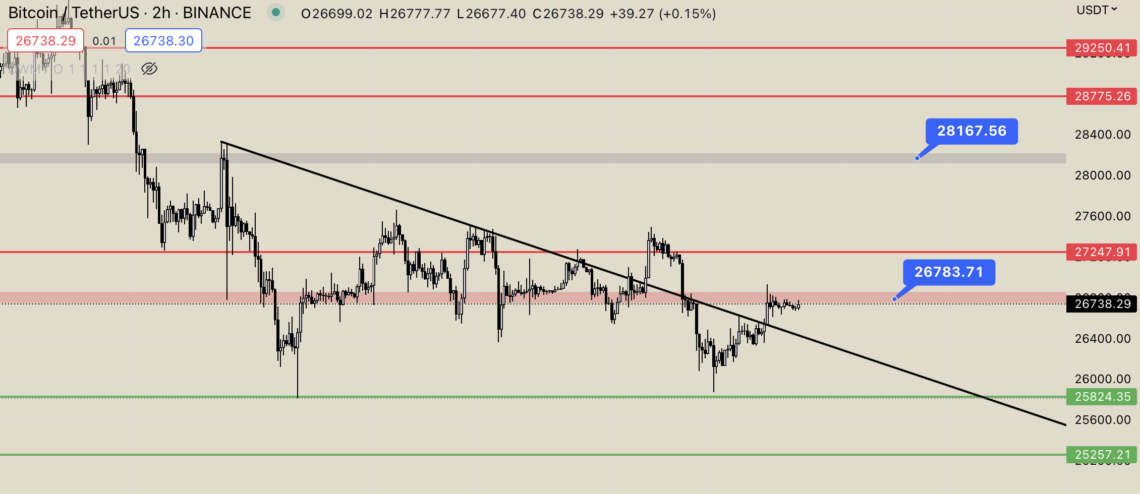
Bitcoin (BTC) Chart Analysis
Bitcoin, which ended the unstable price structure by breaking the falling trend, managed to reach $ 26,780. BTC, which is currently trading at the resistance level, will draw its course according to the reaction it will receive from this level. The fact that it did not gain a full buyer despite breaking the trend was an indication that the uptrend was weak.
In the name of the fact that the increases on the BTC side are not stable, persistence above $26,740 – 27.250 – 28.170 – 28.775 and 29.250 dollars can be followed, respectively. On the other hand, in the weighting of sell-side transactions, decreases to $25.825 – $25.260, respectively, are possible.