
Bitcoin slumped below the key $28,500 support zone once again. According to technical analysis by NewsBTC’s Aayush Jindal, it could continue to decline towards the $27,500 support.
Bitcoin Facing Selling Pressure
Bitcoin broke below the key $30,000 resistance zone and started a fresh decline. There was a sharp move below the $28,500 support zone. The bears pushed the price below the $28,000 level. The price even tested the $27,500 support and a bottom was formed near $27,505. However, there was a strong recovery and the price settled above $28,500. The bulls pushed the price above $29,000 but struggled near $29,600. There is also a major bearish trend line forming with resistance near $29,600 on the hourly chart of the
BTC/USD pair. Bitcoin traded below the 23.6% Fib retracement level of the upward move from the $27,505 low to $29,749 high.
BTC is now trading below the $29,000 level and the 100 hourly simple moving average. An immediate resistance is near the $29,250 level. The next major resistance is near the $29,600 level and the 100 hourly simple moving average.
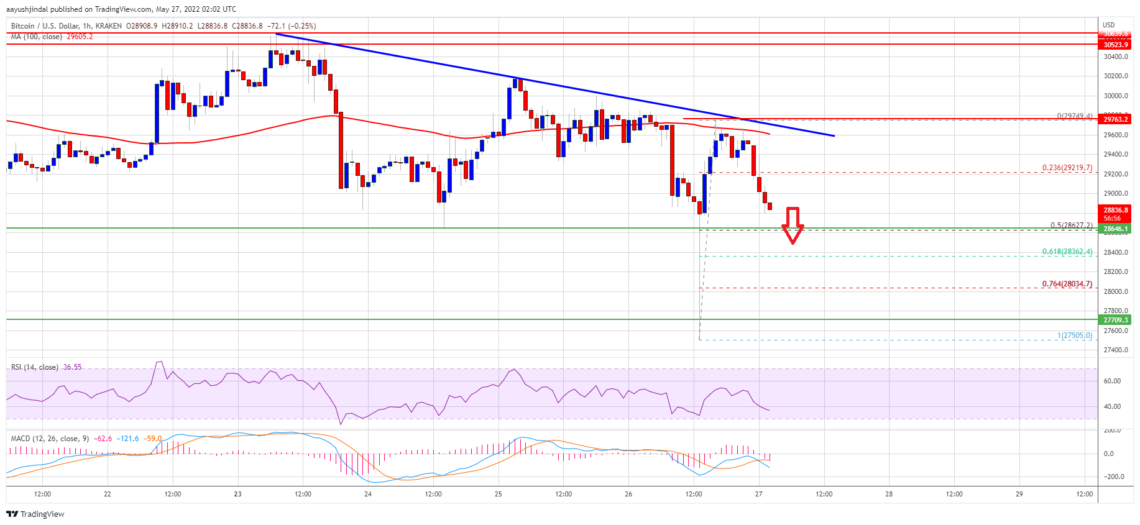
The main resistance is located near $29,750. This is close to the 50% Fib retracement level of the upward move from the $27,505 low to $29,749 low. A clear move above the $29,750 resistance level could start a strong rise. In the stated case, the price could rise towards the $30,600 resistance zone.
Will Bitcoin Drop?
Jindal says that if Bitcoin fails to break past the $29,600 resistance zone, it may continue to move down. According to him, an immediate support is near the $28,650 level. The first major support is near the $28,500 level. A downside break below the $28,500 support could push the price down further. In the indicated case, the price could revisit the $27,500 support zone.
What Do Technical Indicators Say?
- Hourly MACD – The MACD is now gaining momentum in the bearish zone.
- Hourly RSI (Relative Strength Index) – The RSI for BTC/USD is currently below the 50 level.
- Major Support Levels – $28,500 followed by $27,500
- Major Resistance Levels – $29,600, 29,750 and $30,600