
The altcoin market is witnessing a spike in the wake of macroeconomic events such as the US debt ceiling agreement. In the midst of this recovery, several altcoins have started to make up for their recent losses. In the continuation of the article, you can find altcoins that give a bullish signal according to technical analysis.
Bullish altcoins may explode in June
Left (LEFT)
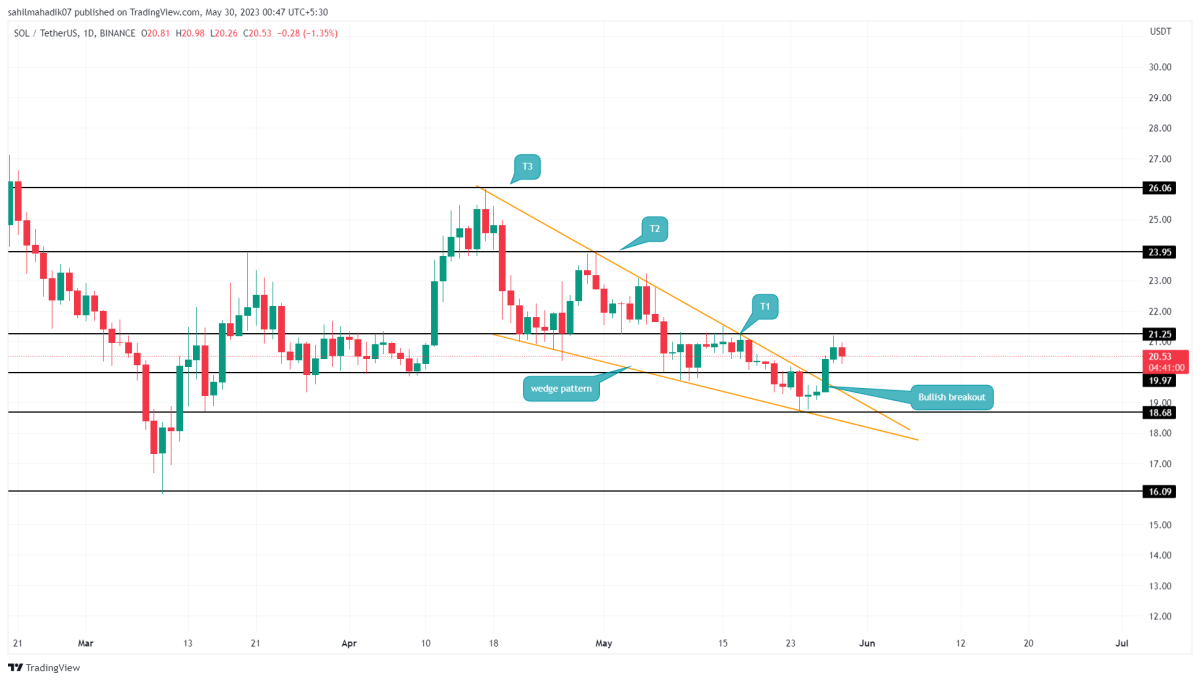
Solana has resonated between two converging trendlines of the wedge formation during the last five-week correction phase. Gradually converging trend lines indicate that sellers are losing momentum. This reflects that buyers have finally regained control of the trendline.
Thus, on May 27, SOL price provided a major breakout from the pattern’s resistance trendline. Thus, it pointed to a positive change in market sentiment. As of now, SOL price is trading at $21.05 with intraday gains of 1.89%. Technical analysis shows that it could rise 27% to price levels like $24 or $26.
Chainlink (LINK)
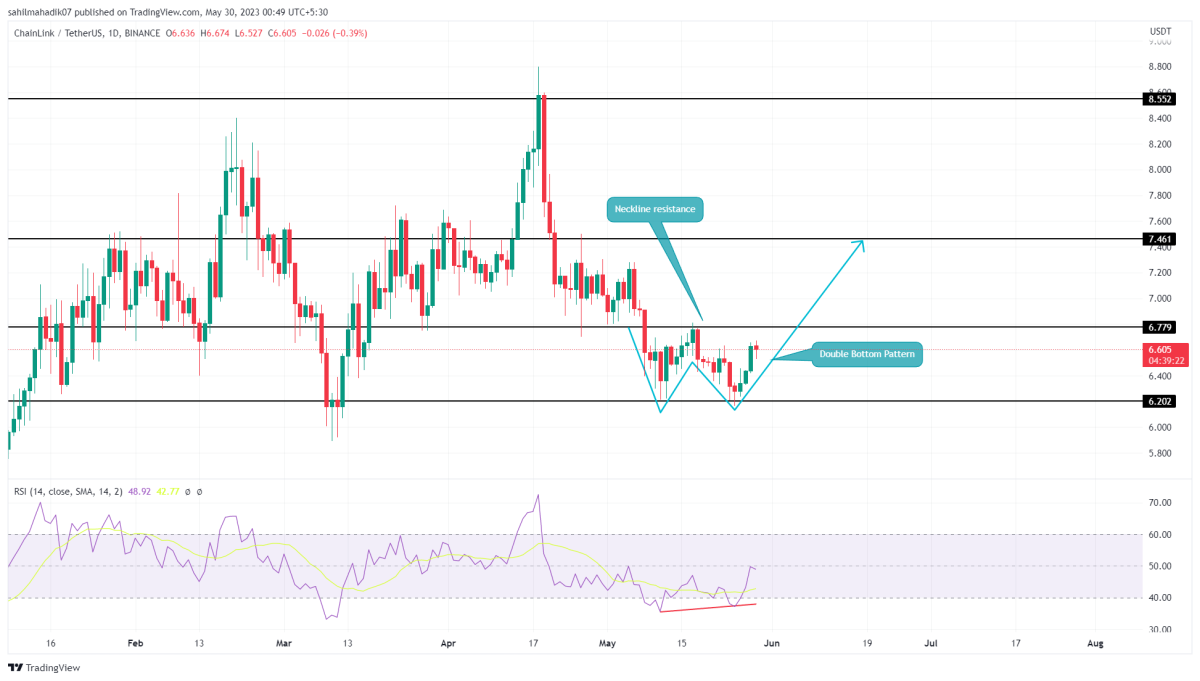
In the middle of the last phase of volatility in the altcoin market, the sideways trend of Chainlink price supports $6.2. Using this level as a base support, LINK price shows the formation of a double bottom pattern on the daily time chart.
This pattern accumulates bullish momentum and usually triggers a significant rally upon break of the resistance neckline. Currently, LINK price is trading at $6.56. But under the influence of this pattern, technical analysis shows it could reach $6.68. If buyers can successfully convert this resistance to support, this altcoin could rise another 10% to reach $7.47. Then there are the $8.5 and $9.5 resistance levels.
Cosmos (ATOM)
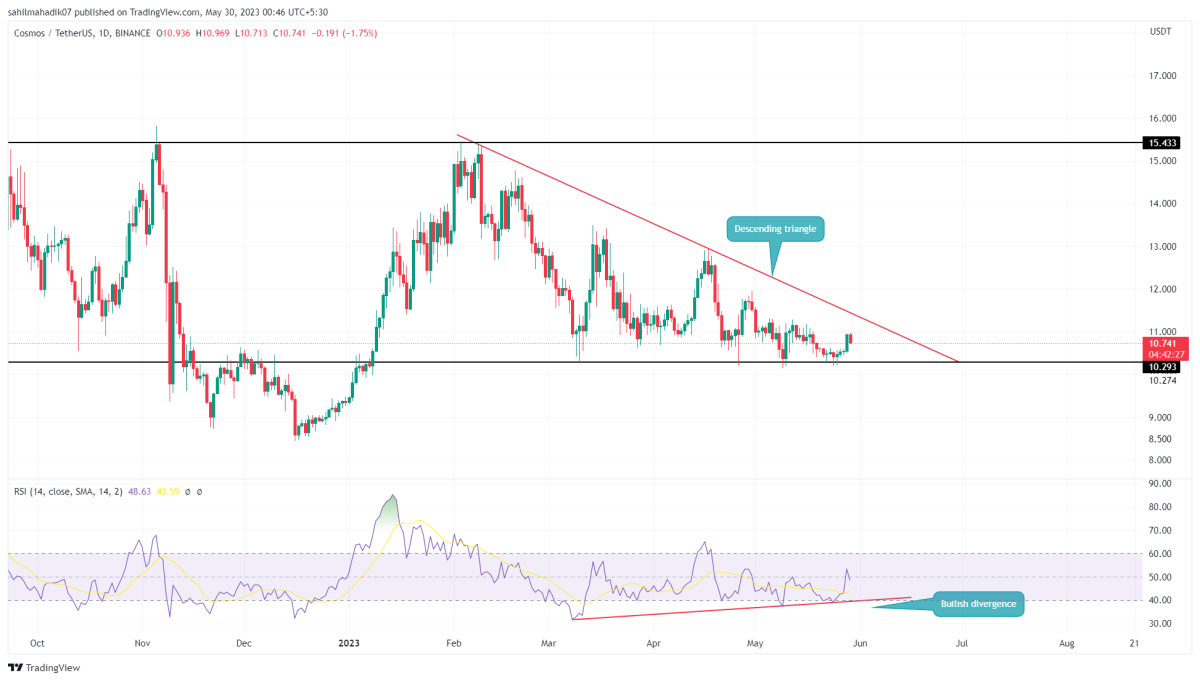
On the daily time chart, ATOM shows the formation of a descending triangle pattern. Theoretically, this pattern is a downtrend continuation pattern, though the RSI is rising, reflecting the momentum of its recent price.
This bullish divergence shows that the underlying bullish momentum is increasing. Therefore, ATOM price also retains the possibility of breaking the general trendline. An upside break from this resistance with a daily candle close will push the price up 43% to $15.4.
Michaël van de Poppe says Litecoin can rally with halving
The popular crypto analyst says Litecoin (LTC) is ready for a strong uptrend leading to the third halving. According to Poppe, Litecoin must first surpass the $93 resistance to start the halving rally:
There is a lot of volatility on this chart, but the higher time frame resistance is at $93. Currently, support is found at $82 and a strong bounce -> weekly candle looks good. If we break $93 next week, the halving rally could begin.
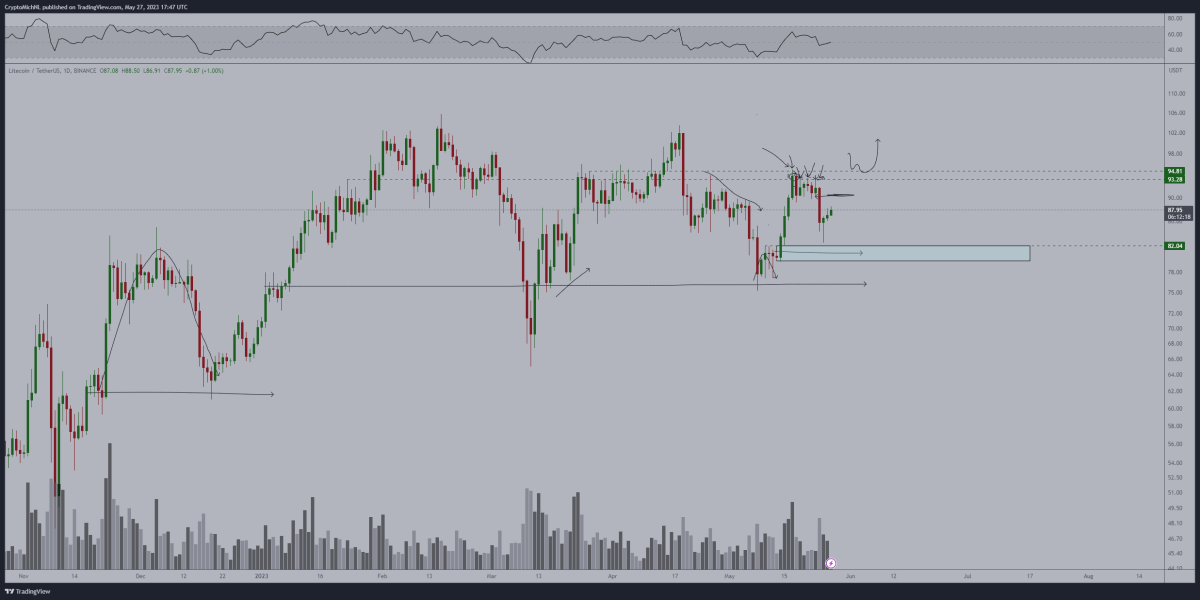
Litecoin’s next halving cycle is expected to take place on August 2, 2023. LTC is currently trading at $91.54. The first resistance Poppe pointed to higher levels is at $93.
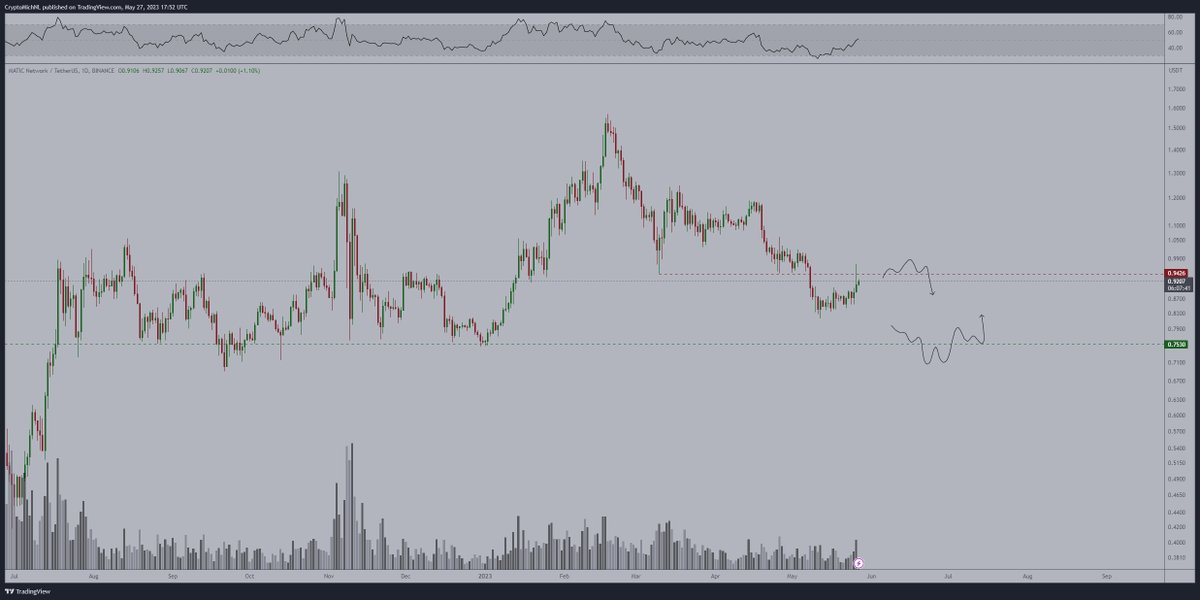
Polygon (MATIC)
As for Polygon, according to the crypto analyst, MATIC could rise as high as 61% if it manages to break through a key resistance level. According to their analysis:
I really want to see it cross $0.95, then we can accelerate towards $1.30-1.50. If this is not the case, shorts are activated and longs can be bought at $0.75.
Graph (GRT) calls altcoin bulls
Graph’s (GRT) price bounced back from a key support level and registered a bullish reversal pattern. After retesting the key support level at $0.105 during the week of May 8-15, the price rallied forming a star pattern (green arrow). This move is a bullish pattern that often leads to a trend reversal.
In addition, when we combine this level with the low level reached by the GRT price in the week of March 6-13, a double bottom formation emerges. Notably, it is accompanied by another bullish signal, the RSI (blue line) bullish divergence. Therefore, GRT price is likely to retest the long-term resistance level at $0.175 in the near future.
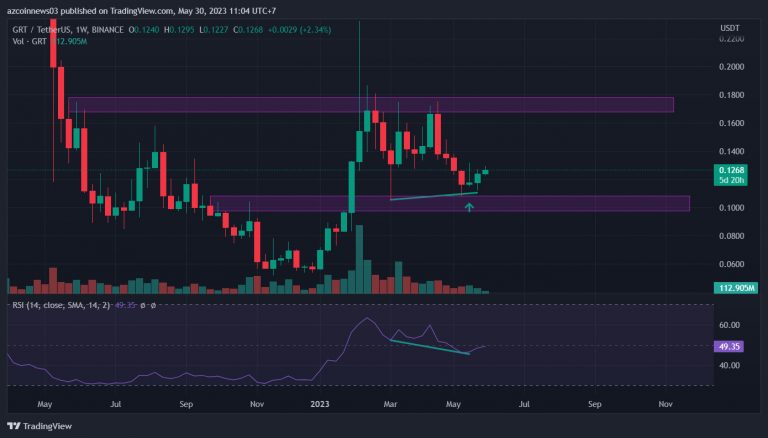
GRT is currently trading at $0.1287. In the short term, the first target of the bulls will be the dollar zone, which is the resistance of the triangle. This level will lead the bulls to the target of 0.15 later. Technical indicators show that the GRT price will rise further in the coming days, breaking above the nearest resistance. The target is at $0.15 and potential higher levels are at $0.175.
Watch out for the Chinese bull
cryptocoin.com As we reported, Luke Martin, a Youtuber crypto analyst, shared 5 altcoins that he expects to rise after the latest news from China. The analyst’s rally expectation is based on the latest developments from China.