Bitcoin, which lost 5 percent after its sharp rise ( BTC), continues to shake the market, Does this mean a trap for BTC?
Reaching $26,000 to $28,400 in approximately 5 days BTC In the morning hours, this rise took some of it back. He even made contact with $27,000. BTC , broke below the decision level of $ 27,250. The fact that BTC could not hold on to the upper prices, seeing such a large selling wave, created claims that the five-day rise could be a “trap”. What does the bitcoin chart say? Can the falls continue?
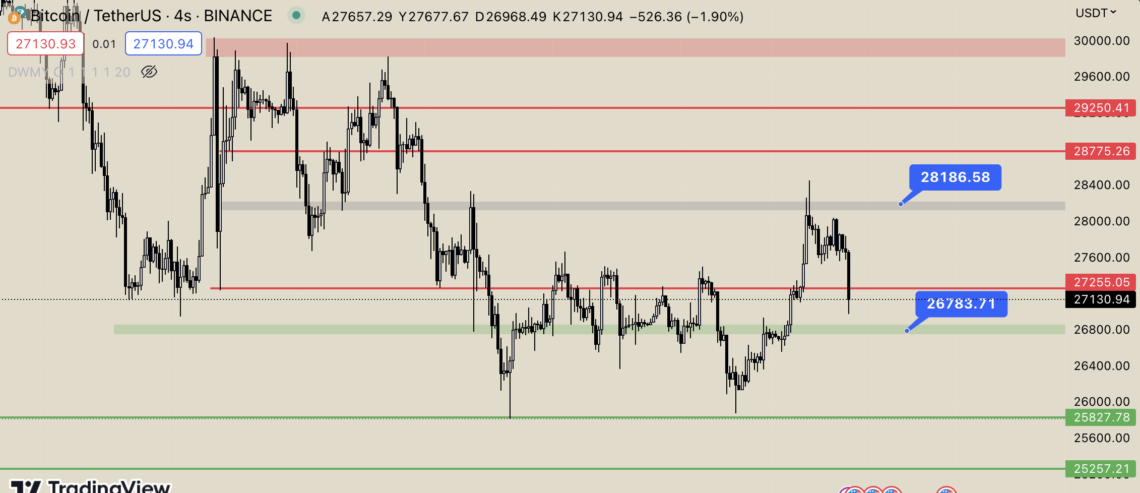
Bitcoin (BTC) Chart Analysis
BTC, which broke down after touching $ 28,450, has lost 5.30 percent in the last two days. The leader of cryptocurrencies, which hangs below the $ 27,250 support, has seen a big sale, especially in the last 4-hour candle. The fact that the price could not hold on to the resistance and showed such a voluminous decline created suspicion that the rise could be a trap.
If the declines on the BTC side continue, the support levels that can be followed are $26,780 – $25,830 and $25,250, respectively. BTC breaking above resistance again and positive news that could drop to the market could push the price to $27,250 – 28.190 – 28.775 – 29,250 and finally $30,000 respectively.