
Bitcoin price is about to break the monthly green candle series it has been continuing since the beginning of the year in May. Rising prices reversed on the last day of the month as the debt ceiling crisis in the US was resolved. Crypto analysts are listing new technical levels for June, accompanied by developments in the US.
Bitcoin starts giving green signals for June
Jim Wyckoff
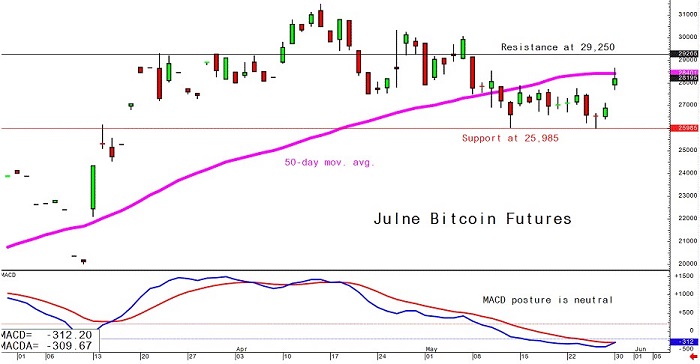
According to Jim Wyckoff, senior technical analyst at Kitco, Bitcoin’s strong performance over the past weekend helped June Bitcoin futures hit three-week highs in early trading on Monday.
“A price downtrend was rejected on the daily chart,” Wyckoff said. Thus, the bulls gained momentum. “In the short term, they have had a slight technical advantage overall,” he says.
Gunter Lackmann
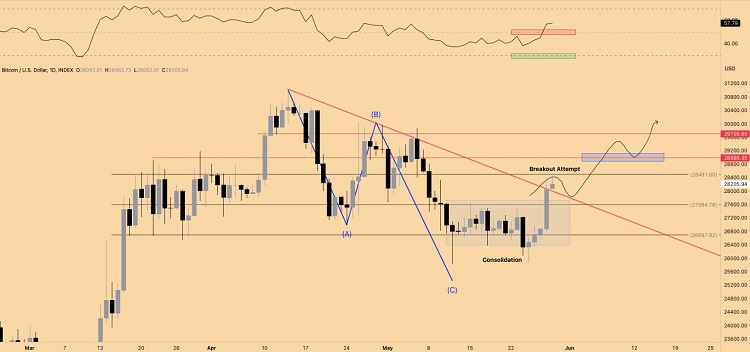
According to the latest analysis by Gunter Lackmann of MN Trading, after hitting $28,400 on Sunday, Bitcoin should hold $27,000 for the week if it hopes to continue its positive momentum.
“A drop below $27,500 back to the consolidation range would invalidate the potential end of the ABC correction,” Lackmann said. It is in question that a new bottom will follow towards 25 thousand. All this will take is a “surprise” return on Fud towards crypto this week, he says. BTC is currently leaking slightly below $27,000, which the analyst identified as critical support.
Michael van de Poppe
Popular crypto analyst Michaël van de Poppe posted the following tweet yesterday highlighting the importance of Bitcoin holding the $27,200-$27,400 support level. Poppe was expecting a rise to $30,000 if Bitcoin holds this zone.
#Bitcoin is looking at continuation here.
What's the ultimate level to hold?
It's the $27.2k-27.4k level.
If that holds, continuation to $30K. pic.twitter.com/GHCOA30hLN
— Michaël van de Poppe (@CryptoMichNL) May 30, 2023
Mustache
Another market analyst, Mustache, stated that Bitcoin’s 20 and 200-day MAs are about to make the first golden cross in history.
#Bitcoin $BTC is about to make the first golden cross of the MA20/200.
This has NEVER happened before.🎯
At the same time, both bands are serving as support right now.
The death cross in Sep. 2022 happened just before the FTX-Crash.
It's time to put the dark times behind us pic.twitter.com/hxJ3nVZblP
— 𝕄𝕠𝕦𝕤𝕥𝕒𝕔ⓗ𝕖 🧲 (@el_crypto_prof) May 30, 2023
Kevin Svenson
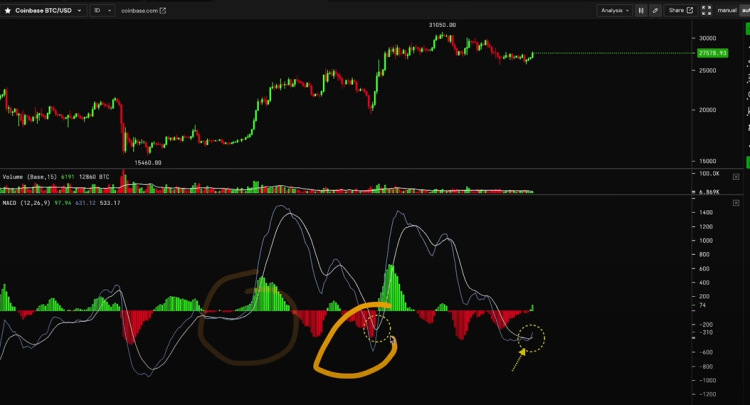
Kevin Svenson, popular on Youtube and Twitter, says that Bitcoin’s MACD indicator is on the daily chart. At this point, the analyst stated that Bitcoin is preparing for a parabolic surge.
According to Svenson, Bitcoin has risen sharply the last two times the MACD has been bullish on the daily chart. In their analysis, “We saw it with a 45% increase right after our MACD crossover and when we crossed earlier this year. “We went from about $16,000 to over $20,000, $23,000, and $24,000.”
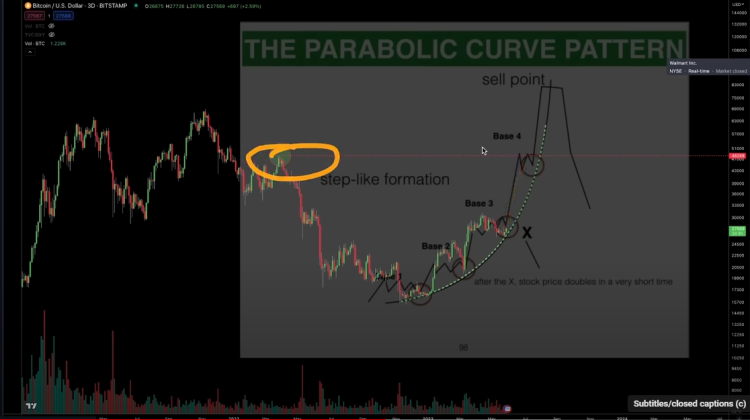
As for a potential Bitcoin surge target, Svenson says he’s looking at Bitcoin’s potential parabolic setup. According to the analyst, Bitcoin is following the parabolic curve cheat sheet “to a T.”
As for the price target, “What this diagram suggests is that the next move will really get us to $48,000”
Benjamin Cowen
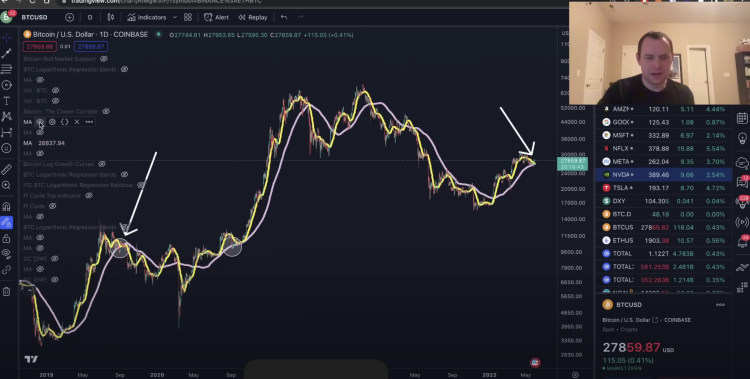
Elsewhere, popular technical analyst Benjamin Cowen took a look at Bitcoin’s historical data. Cowen warns that Bitcoin may be repeating the 2019 price formation that led to the market correction.
In his current analysis, he says the 100-day SMA could determine whether Bitcoin will drop as it did in 2019. In 2019, BTC fell below the 100-day SMA after failing to hold as support on its first attempt. Now sitting at its 100-day SMA after a correction for the first time in years, Cowen says a similar situation may be underway.
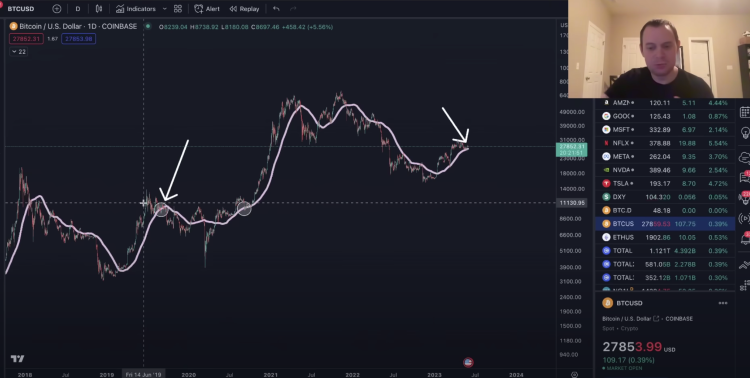
Cowen also adds that the 20-day SMA will help predict whether the market will see a similar 2019 market correction in 2023. In the last part of the analysis, he included:
In 2019, you’ll see that when the daily close is below 100 days, we’re above 20 days and then we’re down again. Right now, we’re back over 20 days. Another interesting thing when you compare these times is the 20 days that fell below 100 days [in 2019] after making this daily close below. The 20-day fell below the 100-day during this rally and then declined again. In 2020, it never crossed the 20-day, 100-day moving average. In 2023, it has not yet surpassed it. I don’t know if it will.
cryptocoin.comIn this article, we have included the critical BTC technical levels that should be considered over the weekend.
BTC price prepares for first monthly drop of 2023
Bitcoin is down another 2.89% in the last 24 hours under selling pressure. It is currently trading at $521 billion with a market cap of $521 billion. If the momentum continues, BTC price will close its first red monthly candle since the beginning of the year.
John Wu
Reaching $31,000 this month, Bitcoin has recorded year-to-date gains of up to 84% at one point. However, this month’s selling pressure slashed earnings to 67%. John Wu, president of Ava Labs Inc., told Bloomberg:
To get a new wave of Bitcoin and crypto buying, what you really need to do is show real benefit and development to get crypto-savvy people into the crypto ecosystem.
Network activity
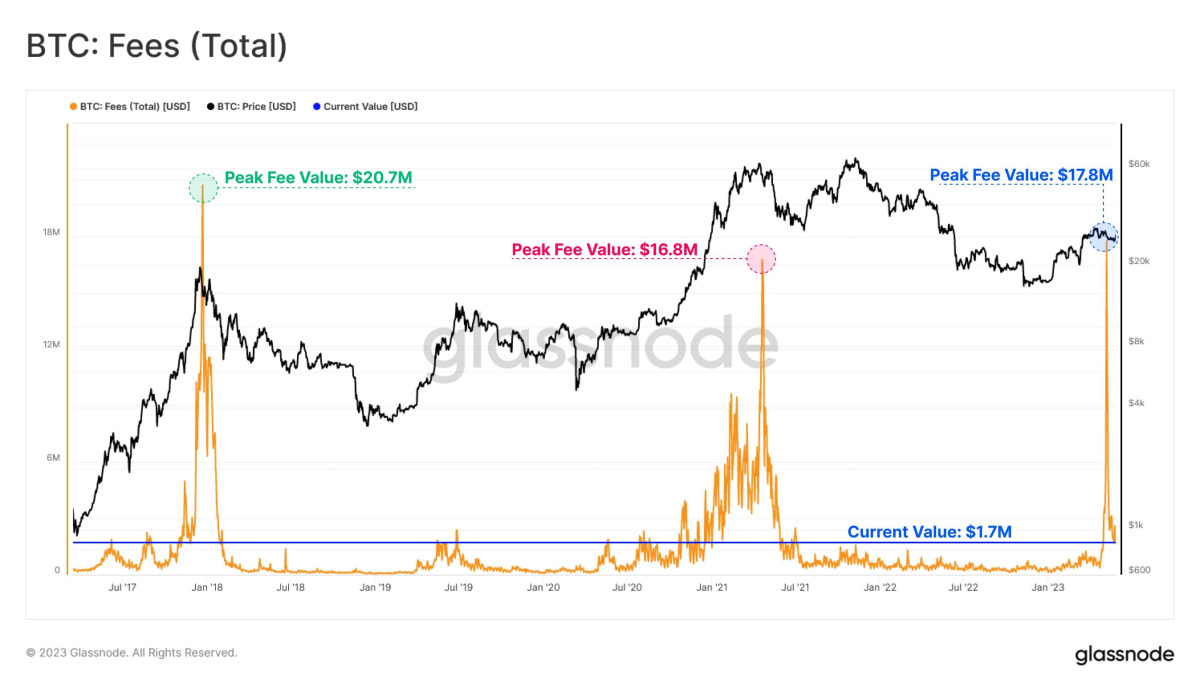
Alongside a strong bullish move for Bitcoin (BTC) price, Bitcoin network activity has increased significantly. This momentum includes NFTs in the form of Bitcoin Ordinals as well as meme tokens. According to analysis by Glassnode:
At the height of the BRC-20 craze, Bitcoin Miners were making $17.8 million in transaction fees, and recorded a larger fee income by just 2 trading days at its 2018 peak. Currently, Miners are generating $1.7 million in fee revenue, down $16.1 million from the last peak. However, this remains significantly higher compared to historical precedence, with only 310 / 4674 (6.7%) trading days posting higher fees.
If the selling pressure continues further, the next support level for BTC price will be at $23,000.


