Which altcoins will be expected to rally this week? This is the most curious question as we enter a new week in the crypto money world. Let’s see what will be the expected cryptocurrencies this week? Let’s take a look at our altcoins-focused article.
Altcoins with the possibility of rally
Among altcoins, Cardano (ADA) price has risen above an important roadblock. Now it looks like it’s ready to exit consolidation. The optimism came as ADA posted a huge spike in transactions approaching 35,000 in 48 hours. Cardano is in breakout signs similar to those experienced in December and March, as shown in the daily chart below. The altcoin has risen above the 50 and 100-day Exponential Moving Averages, where it has been at resistance levels for almost a month. This signals increased momentum among the bulls. If this buying pressure continues, Cardano price will move into the zone served by the 200-day EMA. This level is the $0.39 zone. Such a move would take ADA to $0.41 before hitting the $0.43-0.45 level. The supply zone, in particular, is a large area of resistance defined by intense selling pressure.
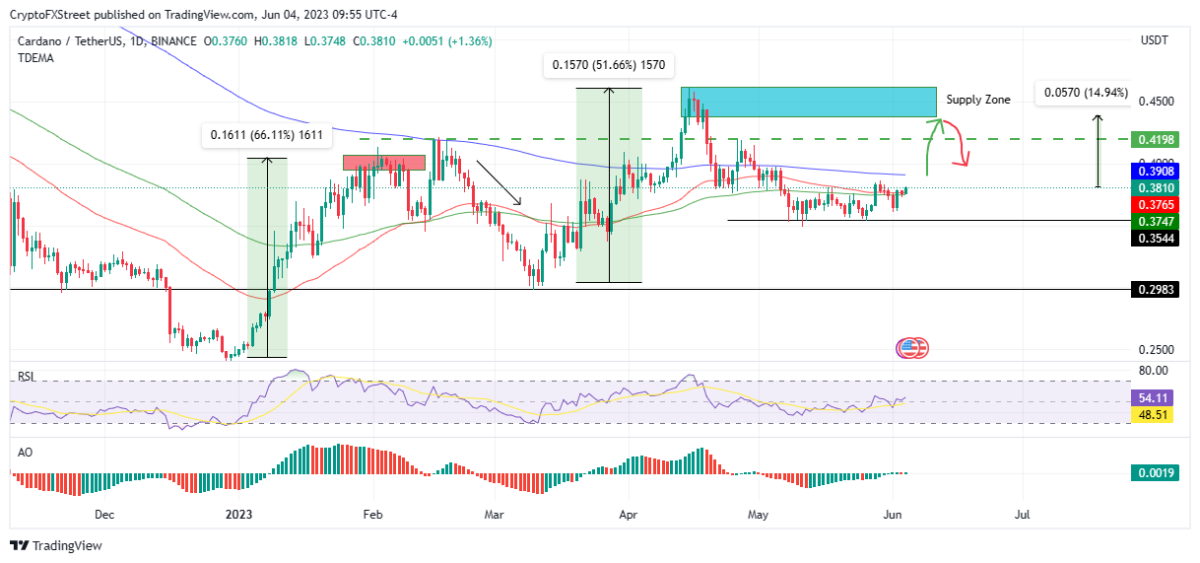
Therefore, traders can place their stop loss at $0.43 for two reasons. First, it will be necessary to lock in the 15% profit made when ADA labels the supply area. Second, it will protect them from corrections and losses that will occur when a sell-off at this level begins. This bullish view is supported by the north-pointing Relative Strength Index (RSI) and the Awesome Oscillator (AO) which has risen above the middle line to show the rising momentum that could push Cardano price higher.
To put this into perspective, notice how Cardano price retraced after testing the supply zone marked in red on the daily chart above. The rise in Cardano price is due to the large number of transactions on the network. Accordingly, the increase comes after recording the net flow value of 6.61 million ADA tokens. Data from IntoTheBlock looks at the number of large transactions since June 2nd. Accordingly, it shows an increase from 10,001 to 14,780 on 3 June.
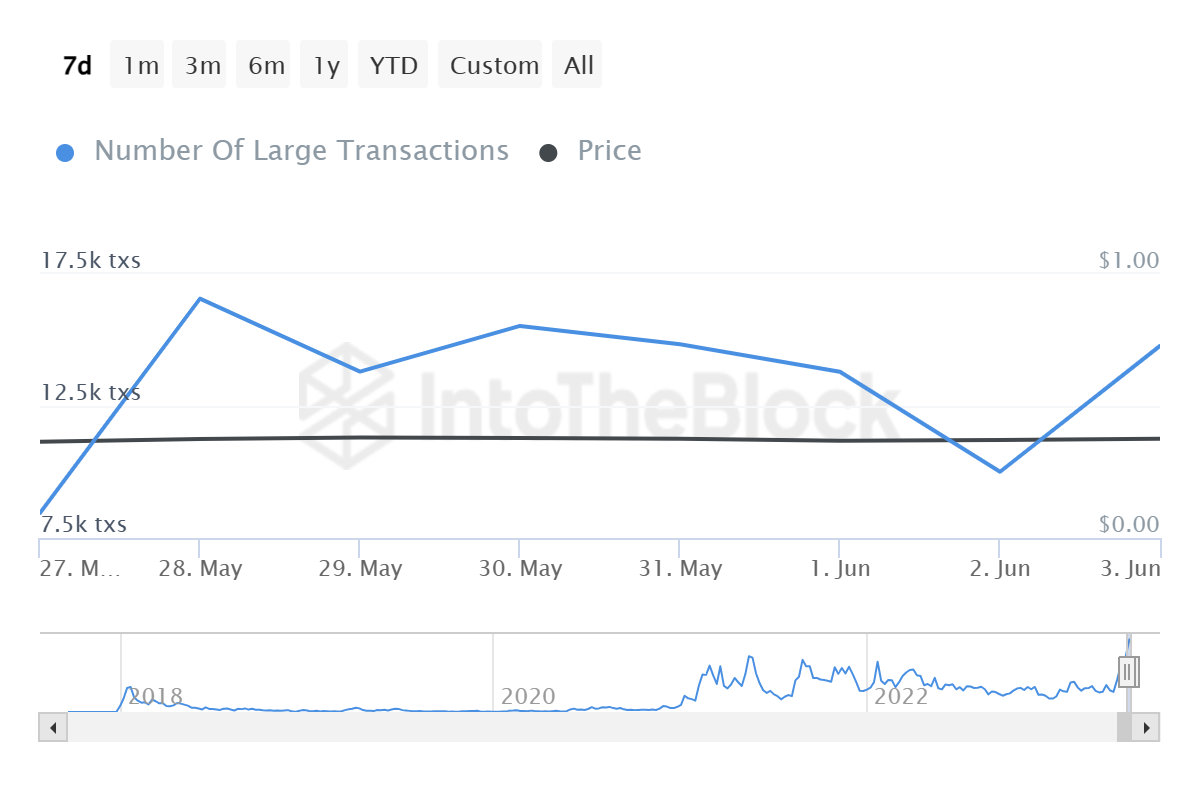
Similarly, the transaction volume increased from 57.77 billion on 2 June to 63.57 billion on 3 June. On the other hand, the selling pressure of the 200-day EMA at $0.39 will pull Cardano price back in altcoins. In this case, it will cause it to fall below the 50 and 100-day EMAs. Finally, it will cause ADA to find the next support at $0.35, where it spent most of May.
Ripple (XRP)
Ripple (XRP) price among altcoins has been on the rise since mid-May. He is thrilled with the victory in the lawsuit against the US Securities and Exchange Commission (SEC). Accordingly, optimistic conversations on the subject continue to excite the XRP community. Ripple price hit $0.65 as the fifth anniversary of Hinman’s speech approaches. At the time of this writing, XRP is trying to achieve its management chart formation before the weekend is over. Accordingly, it was trading just below the neckline. This has led XRP to rapidly move towards the technical target of an inverted head and shoulders pattern of $0.65 as illustrated in the daily chart below. However, for this to happen, the bulls need to secure a one-day candlestick close above the $0.54 barrier that was last tested on April 14.
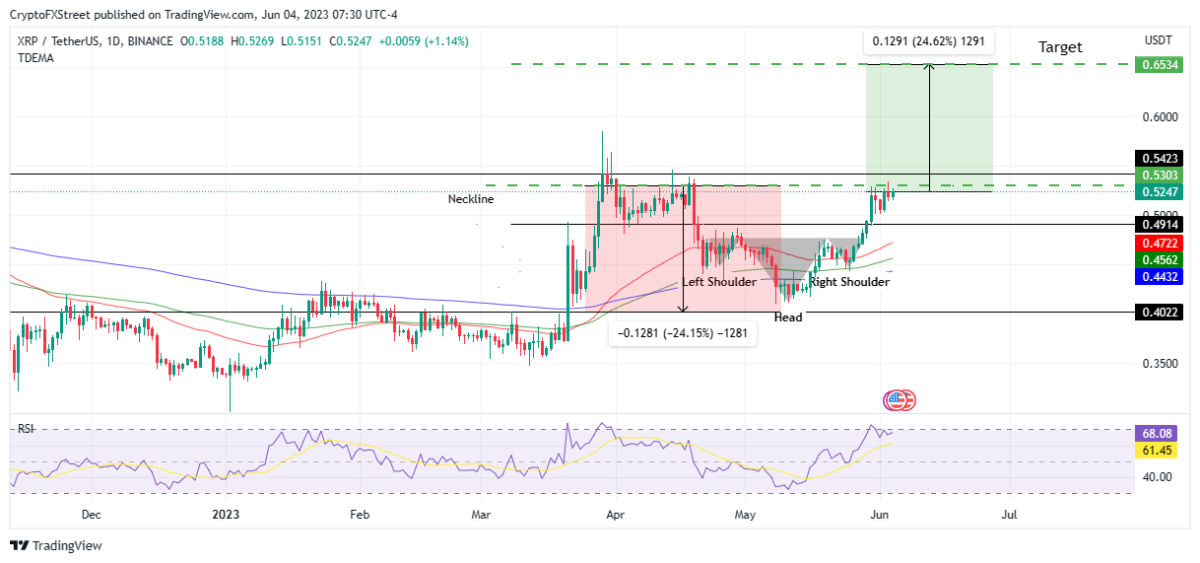
It should be noted that if the price breaks above the $0.53 neckline, the chart pattern will be confirmed. Also note that the management chart formation around $0.65, about 25% above the current price, will open the way to its target. The Exponential Moving Averages (EMA) along with the technical formation also support the positive outlook for XRP. Ripple price is trading above the EMAs. The 50, 100 and 200-day EMAs are at $0.47, $0.45 and $0.44, respectively. These offered solid support where buyers could regroup before scaling another uptrend. Also, the Relative Strength Index (RSI) is headed north. Accordingly, this indicated an increasing momentum. This will bode well for Ripple price.
Conversely, what happens if the profiteers pull the trigger? Ripple price will decline towards the $0.49 support, invalidating the bullish view. Specifically, the RSI at 68 indicates that XRP will soon be overbought. On the other hand, this suggested that it would usually be a move followed by a correction or a pullback. Such a result would indicate that ripple price has broken below the three EMAs or, at worst, found solace around the $0.40 low.
Hedera Hashgraph (HBAR) price
Hedera Hashgraph (HBAR) price within altcoins benefited from social dominance. Accordingly, developments caused HBAR to consolidate support at $0.049. This can also be effective in guiding the uptrend. Notably, there is a lot of uncollected liquidity below this level. Accordingly, the situation becomes stronger for the bulls. What does increased buying pressure above the current $0.050 price indicate? It shows that Hedera price tags the 50-day Exponential Moving Average (EMA) at $0.055. Turning this resistance into support could pave the way for HBAR to complete a 15% climb and face the tough $0.057 hurdle.
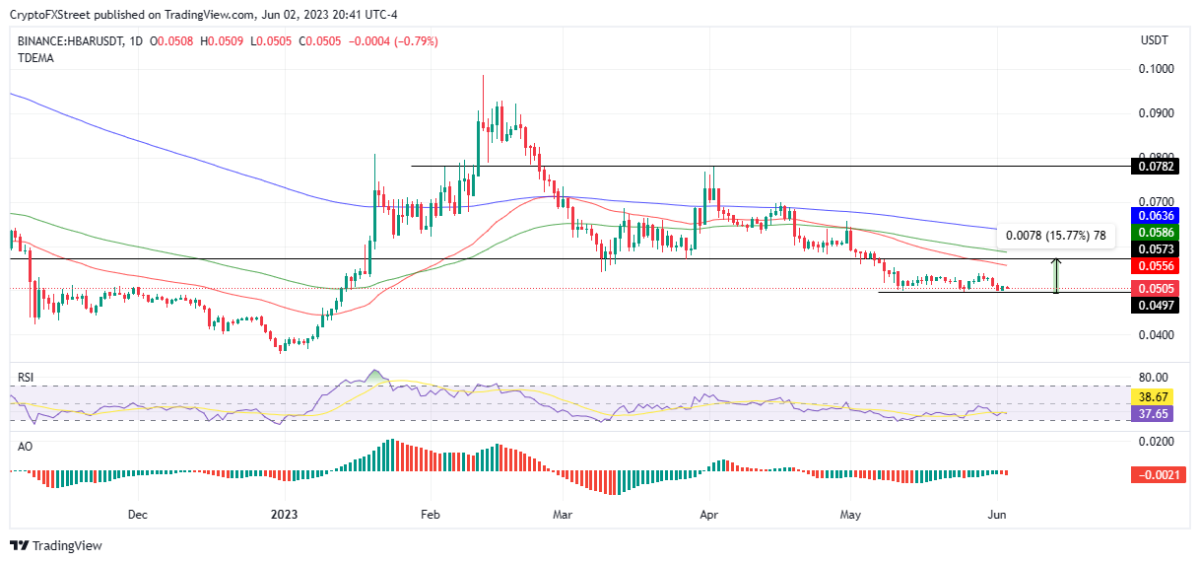
In a highly bullish situation, among altcoins, Hedera price could conquer resistances at $0.058 and $0.063 due to the 100- and 200-day EMA, before attempting to tag the $0.078 resistance level that was last tested in early April. This outlook is supported by the Relative Strength Index (RSI) heading north and the Awesome Oscillator (AO) heading towards positive territory. All in all, this indicates a growing bullish momentum.
chainlink price
Within altcoins, Chainlink (LINK) price has been trading in an uptrend since May 28, when the Parabolic SAR fell below the price. The rise that started on May 26 took the bears off course. Then there was a 10% rally. Chainlink (LINK) price is bullish after Bitcoin (BTC) climbed above the $27,000 range. Despite the accumulating overall pressure offered by the 50-, 100-, and 200-day Exponential Moving Averages (EMA), a newly found momentum has indicated that the altcoin may be enjoying a weekend rally. Increasing buying pressure from the current level will allow LINK to break above the $6.96 resistance level, turn all key EMA resistance levels to support and use it to bounce off the bottom to target new highs.
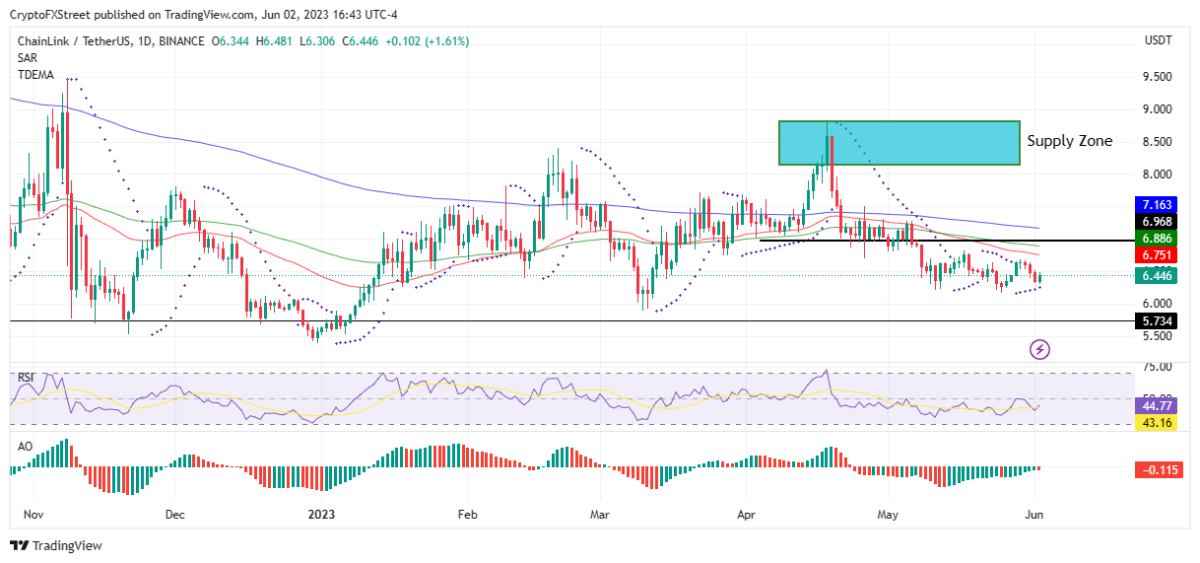
The recommended stop-loss level at which traders and investors can lock in profits while avoiding any losses is the lower end of the supply zone at around $8.17. Such a situation would mean an increase of 30% from the current level.
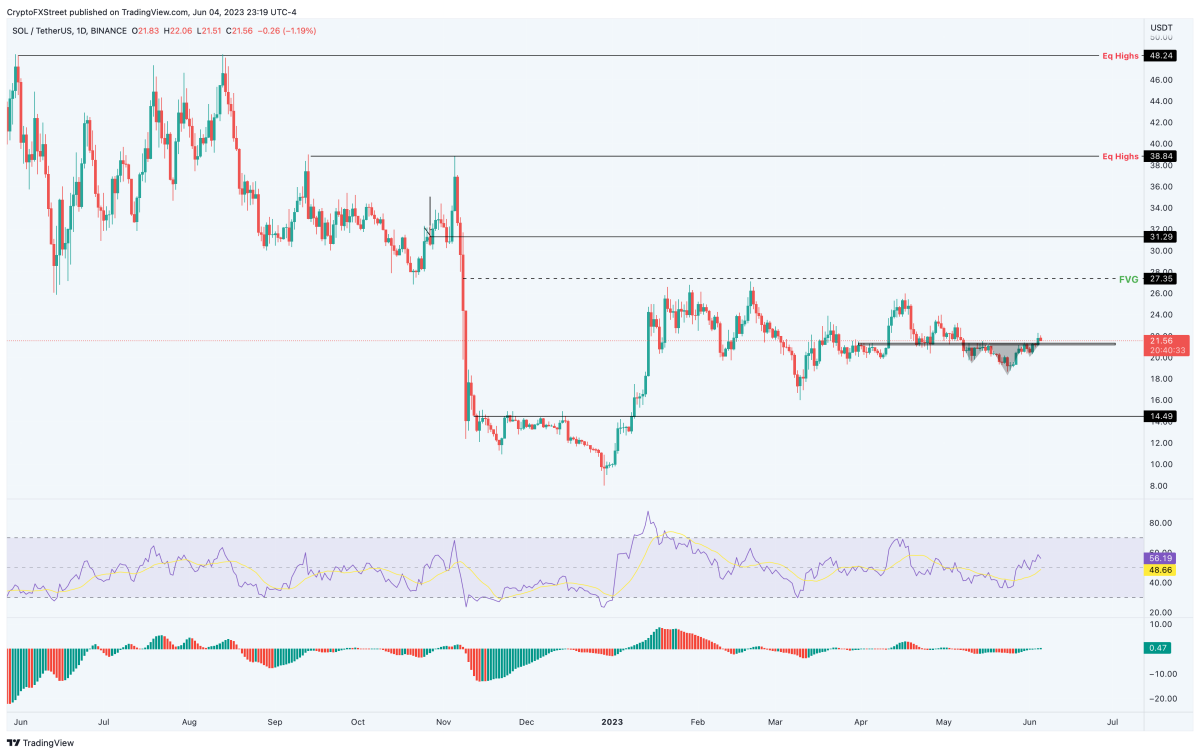
Solana price in altcoins ready for exit
Among altcoins, Solana price is below the $21.34 resistance on the daily chart. Here he created an inverted head and shoulders formation. SOL overcame this hurdle on June 4 and turned it into a potential base of support. The continued withdrawal resulted in an extensive retest. If it stays above $21.34 afterward, traders can expect the uptrend to continue. Further supporting this narrative is the Relative Strength Index (RSI), which has risen above the average line and is now bouncing from that line. Likewise, the Awesome Oscillator (AO) went above the zero line. Both momentum indicators point to an uptrend for Solana. Accordingly, the latest situation points to a recovery rally after weeks of uninterrupted downtrend. If the SOL bulls manage to maintain the momentum, a retest of the $31.29 barrier is also on the cards. cryptocoin.comWhen we look at it as a whole, this move will mean a 46% gain for SOL holders.