Four trillion Shiba Inu (SHIB) tokens were not staked and moved to Binance. This has increased the concerns of ‘sell-off coming’ for the altcoin. Meanwhile, the burn rate for SHIB has increased by over 40% in the last 24 hours. On the other hand, crypto analyst Jakub Dziadkowiec says that SHIB has formed a triple bottom pattern.
Trillions of SHIBs have been moved to Binance!
Whale watching platform Whale Alert announced in a tweet on June 9 that 4,000,379,151,023 Shiba Inu (SHIB) tokens worth $31,709.005 were removed from staking and transferred to Binance. The Shiba Inu community reacted to this massive transfer to Binance. He speculated on whether this would cause a price drop. Typically, it’s normal for millions of SHIB tokens to be unstacked. However, the revelation of trillions of SHIBs in a single transaction adds to uncertainty as SHIB tokens can be thrown on the exchange.
The Shiba Inu community is currently waiting for the Layer-2 Blockchain Shibarium main-net launch, which is expected at the end of the year. Lead developer Shytoshi Kusama hinted that the launch of Shibarium will happen soon. However, the lack of updates on this big event has affected the prices of SHIB and BONE. Meanwhile, cryptocoin.comAs you follow, developers are working on other related projects such as Shiba Inu Metaverse, cold wallet, and SHIB burn.

Altcoin prices react to news
The SHIB price is down 7% this week and 15% in a month. The altcoin is currently trading at $0.00000798. The 24-hour low and high prices are $0.00000789 and $0.00000800, respectively. Also, the trading volume has decreased by 21% in the last 24 hours. This shows that interest among traders is decreasing.
Meanwhile, the BONE price has dropped 2% in the last 24 hours. The altcoin is currently trading at 0.79. The 24-hour low and high are $0.794 and $0.810, respectively. Transaction volume decreased by 21% in the last 24 hours. Meanwhile, whale holdings for both SHIB and BONE have declined, according to on-chain data. But his individual holdings increased.
SHIB burn rate increased
In the last 24 hours, the burn rate for SHIB has increased by 42.62%. Thus, it resulted in the destruction of approximately 5,312,892 SHIB tokens. Thus, a significant portion of the initial token supply amounting to 410,648,972,754,754 tokens was burned. This burning involves the permanent removal of tokens from circulation. As a result, the total token supply decreased. The maximum total supply of the token is currently set at 999,989,401,792,241 tokens, indicating the upper limit of the available tokens that can exist.

Altcoins “triple created a bottom pattern
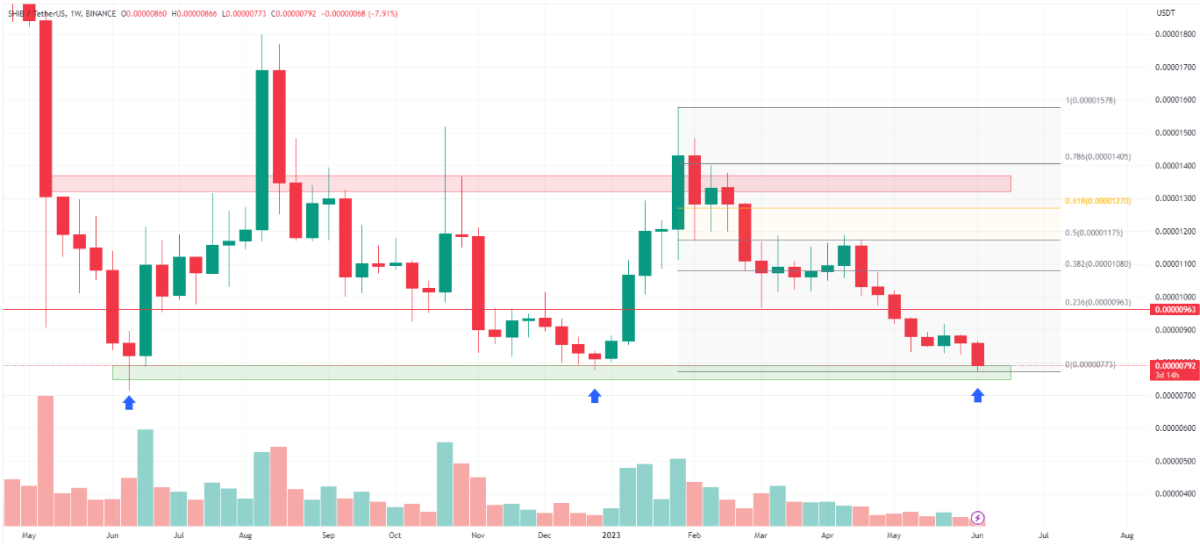
The Shiba Inu price hit an all-time high of $0.00008854 in November 2021. It has been falling ever since and bottomed at $0.00000714 in June 2022. In the past year SHIB has reached this support area (green) three times. The second time is in December 2022 and the third is happening now. Currently the meme-coin is 91% below its ATH. It is again approaching the macro bottom of a year ago.
However, a revisit of the long-term support area is a bullish signal that could potentially trigger a resumption of the uptrend. If the support initiates a bounce, a triple bottom formation (blue arrows) is possible. It’s even rarer as it appears on the weekly chart. In this case, the nearest target would be $0.0000963, which corresponds to the 0.236 Fib retracement level and the horizontal support/resistance line (red). Next, the bulls are looking to retrace the 0.382 Fib retracement level to $0.00001080.
The principle behind the Fibonacci retracement levels is that after a significant price move in one direction, the price retraces or partially returns to the previous level. It then continues to move in the original direction.
 SHIB chart / Source: Tradingview
However, if the Shiba Inu price loses this long-term support, it will fall to new cycle lows. Then support can be found at $0.00000630, the close of the July 2021 weekly candle.
Bullish divergence in daily RSI for SHIB
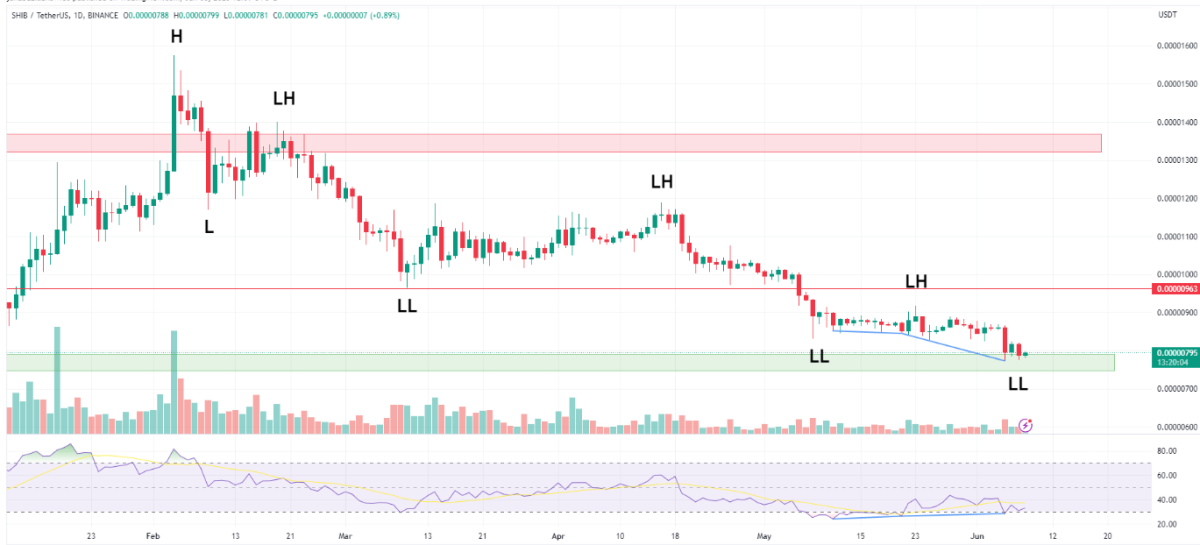
Analysis of the daily time frame for Shiba Inu price shows a clear bearish trend. It has been holding up since the local top of $0.00001575 in early February 2023. Later, SHIB price formed 3 consecutive low tops (LH) and 3 low lows (LL) in a row. The drop in altcoin price was accompanied by a drop in the Relative Strength Index (RSI). It is currently below the 50 level confirming the bearish trend.
By using the RSI as a momentum indicator, traders can determine whether the market is overbought or oversold. In addition, they can decide to accumulate or sell assets. If the RSI value exceeds 50 and the trend is up, the bulls have an advantage. The opposite is true when the data is below 50. However, a bullish divergence emerged in the RSI between the last two lows. This means that although the SHIB price is falling, the corresponding RSI is starting to rise (blue lines). Moreover, the indicator has already managed to create two instances of this bullish divergence, suggesting that a strong price bounce is imminent.
 SHIB chart / Source: Tradingview
Indeed, if this SHIB bullish pattern proves to be correct, the altcoin price could at least rise to the above-mentioned $0.00000963 resistance. On the one hand, this would be a bearish retest of the previous breakout area. On the other hand, SHIB price will form the first high low in 5 months. Also, it will potentially start an uptrend.


