Falling US Treasury yields and the unrelenting selling pressure surrounding the dollar helped gold close in positive territory for the second week in a row. As the focus shifts to the US May jobs report, the technical outlook shows that the yellow metal will continue to rise as long as $1,840 remains as support for gold prices, according to market analyst Eren Sengezer.
What important developments took place for gold prices last week?
Gold started the new week calmly but managed to post daily gains on Monday as the dollar continued to weaken against its main rivals. The downside trend in risk sentiment amid disappointing macroeconomic data from the US caused US Treasury yields to drop on Tuesday, allowing gold to hit a nearly two-week high of $1,870.
S&P Global Composite PMI in the US dropped from 56 in April to 53.8 in May, revealing that the private sector has lost growth momentum in business activities. The data also fell short of the market expectation of 55.5. Commenting on the PMI survey, Chris Williamson, Chief Economist at S&P Global Market Intelligence, said: “Companies are reporting that demand is under pressure due to concerns about the cost of living, higher interest rates and a broader economic slowdown.” In addition, the US Census Bureau reported that New Home Sales contracted by 16.6% MoM in April, reflecting the negative impact of current financing conditions on the housing market. As reported in
Kriptokoin.com news, on Wednesday, the FOMC’s May meeting minutes show that most policy makers will have two interest rates of 50 basis points in the next two meetings. He noted that they agreed that an increase in inflation would be more appropriate and that the inflation risks were heading upwards. The publication showed that, regarding the Fed’s balance sheet reduction plan, a number of respondents felt they should consider selling mortgage-backed securities as the runoff continues. The Fed’s hawkish tone helped the dollar find demand, causing gold to pull back in the second half of the week.
Indicator With the 10-year US Treasury bond yield falling to 2.7% on Friday, gold prices regained momentum and climbed to the $1,860 area. Also, analyst Eren Sengezer notes that the 200-day SMA remained intact after the downside correction, allowing buyers to remain in control of gold’s price action.
Ahead of the weekend, the US Bureau of Economic Analysis reported that the Personal Consumption Spending (PCE) Price Index fell to 6.3% year-on-year in April from 6.6% in March. . The annual Core PCE Price Index, the Fed’s preferred inflation indicator, fell to 4.9%, in line with expectations.
What is on the agenda of the next week that will affect gold?
NBS Manufacturing PMI and Non-Manufacturing PMI data will be released on the Chinese economy on Tuesday. Both of these data are expected to recover in May after the significant decline in April. According to the analyst, if PMI data falls short of market expectations and reminds investors of the negative impact of coronavirus-related restrictions in China, gold is likely to lose altitude and vice versa.
In addition, Eurostat will publish HICP inflation data for the euro area. Several ECB policymakers said last week that a 50 basis point rate hike would not be on the table at the policy meeting in July. The analyst says the dollar could continue to weaken if investors start pricing a double dose of ECB rate hikes amid hot inflation data.
On Wednesday, the US’s ISM Manufacturing PMI will be watched closely by market participants who are increasingly worried about a possible recession in the US. According to the analyst, if these data show that business activity in the manufacturing sector continued to expand at a strong pace in May, the dollar could start a recovery and limit the rise of gold.

The U.S. Bureau of Labor Statistics will release its May employment report on Friday. Non-Farm Payrolls (NFP) are expected to increase by 310,000, after an increase of 428,000 in April. The analyst notes that the wage inflation component of the report could influence market movement unless the NFP data presents a major surprise either way.
Average Hourly Earnings is expected to increase 5.6% year-on-year in May. Strong wage inflation could be seen as a factor that could keep consumer inflation higher for longer than expected and remind investors that the Fed is willing to tighten its policy aggressively. In this scenario, the analyst says, gold could turn south amid a recovery in US bond yields.
Also, the analyst states that the uptrend that started in December is aligned with the 23.6% Fibonacci retracement of 2.7%, an important technical level for the 10-year US T-bill yield. If this support fails, a sharp drop in US yields could open the door to a gold rally.

Gold prices technical view and gold sentiment survey
Market analyst Eren Sengezer said that gold’s 200-day SMA and Fibonacci He states that the last downtrend closed above the 23.6% retracement and shows that the sellers continue to stay on the sidelines, and continues his analysis as follows.
On the upside, $1,870 (Fibonacci 38.2% retracement) aligns as the next resistance. Should gold break above this level and start using it as support, it could target $1,890 (100-day SMA and Fibonacci 50% retracement) and then $1,900 (psychological level, 50-day SMA).
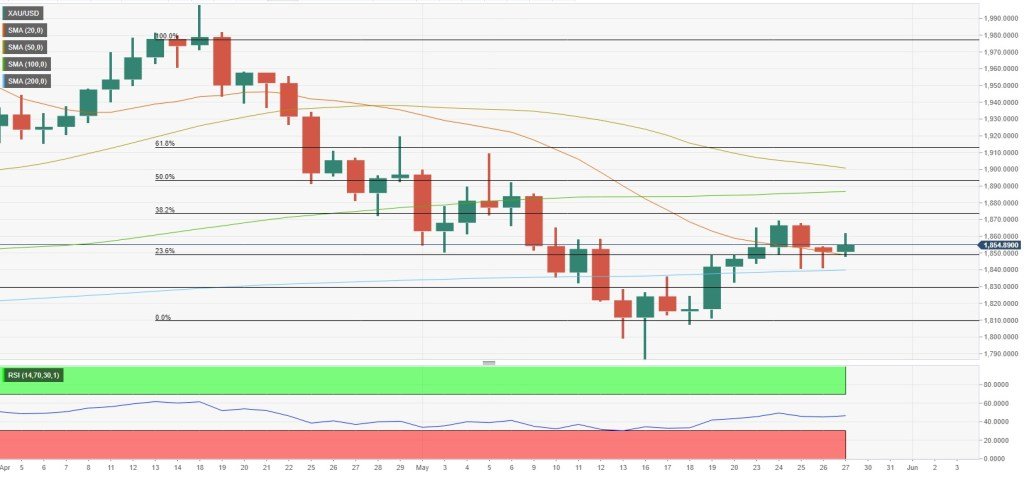
On the other hand, $1,850 (Fibonacci 23.6% retracement) forms initial support ahead of $1,840 (200-day SMA). Only a one-day close above the latter could attract sellers and cause the short-term technical outlook to turn bearish. In such a scenario, $1,830 (static level) could act as the next line of defense.
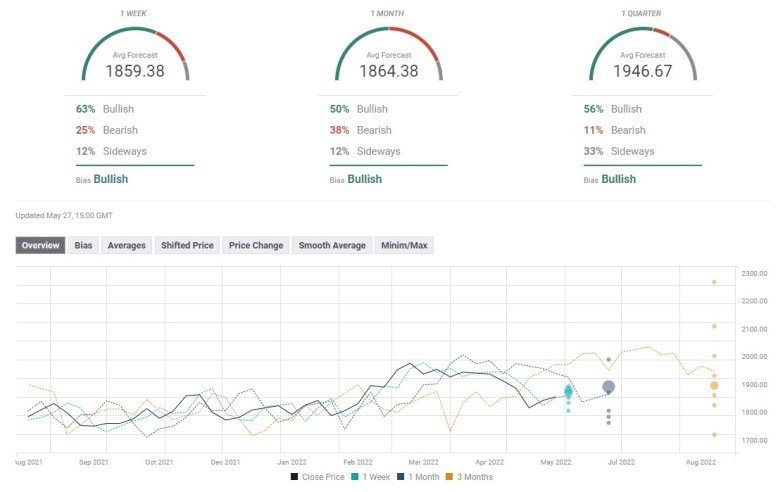
The Gold Forecast Survey shows that the majority of experts predict that gold will continue to rise next week. The one-month outlook paints a mixed picture, with the $1,864 average target showing a lack of consensus among analysts.