
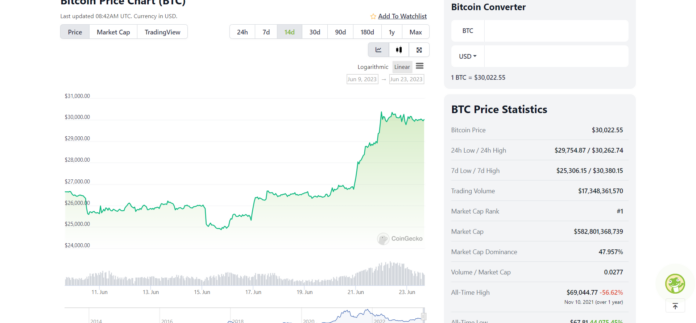
A bear market in the cryptocurrency world is when we see a long-term bearish trend. Assets are withdrawn by at least 20% during this period. In November 2021, we saw Bitcoin’s $69k ATH. Since then, Bitcoin has lost 56% of its value. Right now, we seem happy with the $30,000 BTC price tag. On the other hand, many altcoins have lost 90% of their value. However, we recently saw a huge jump from Bitcoin to the $30,000 mark. So, have we reached the bottom of the bear market?
What is a cryptocurrency bear market?
Bear markets can be a difficult time to get out of. You can see your profits evaporate. The result is a lot of panic selling. Many investors leave the field. However, for others, it presents a great opportunity to buy assets at fire sale prices. You can lay the foundation for a successful bull run during bear markets.
Assets that you can currently buy at a low price could gain 5x, 20x, 50x or even 100x during the next bull run. And then there is only one entity that always does 1000x. So, aside from the prolonged price pullback, there are a few other bear market signs. For example:
- An overall loss in investor confidence.
- Few new investors.
- Lots of FUD (fear, uncertainty, doubt) and other negative news pushing prices down further.
Macroeconomic events over which we have almost no control can also initiate a bear market. Or, for example, you can extend it. For example, COVID-19 in 2020 or the Russian invasion of Ukraine and the ensuing war.

Some indicators for the bear market
You can track the performance of cryptocurrencies in many ways. You can see how the market conditions are by using some TA (technical analysis) tools. For example, do these TA tools indicate that we are still in a bear market or that we are already bullish? So we won’t overwhelm you with too many options. However, here are two that are easy to follow and give good and strong signals.
Bitcoin Rainbow Chart
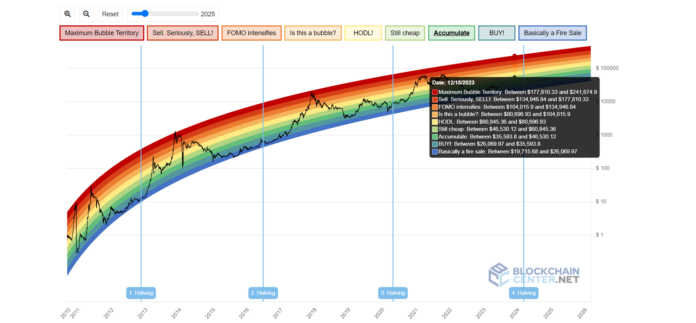
The first indicator is the Bitcoin Rainbow Chart. This is a chart with color coding. Each color gives you an idea of what to do. For example, dark red means selling as fast as possible and making a profit. On the other hand, the blue color tells you that you are in the fire sale zone. Buy as much as you can here.

The graphic also allows zooming in and out. You can also change a slider. This will allow you to see the options foreseen for Bitcoin in the future. For example, on January 1, 2024, dark red means that BTC is between $ 180k and $245k. However, if Bitcoin is still in the blue zone, we are looking at a BTC price between $20,000 and $26,000. Here is a picture of the current Bitcoin Rainbow Chart.
Weekly RSI for cryptocurrencies
Another useful indicator is the weekly RSI. This is the ‘Relative Strength Index’. It is a common indicator. Accordingly, most exchanges have one in their spot markets. The RSI indicates whether an asset is overvalued or undervalued.
- 70 or above means overvalued. BTC is overbought. Be prepared to retreat.
- 30 or less means low value. BTC is oversold and a recovery is possible.
- 30 to 70 means neutral.
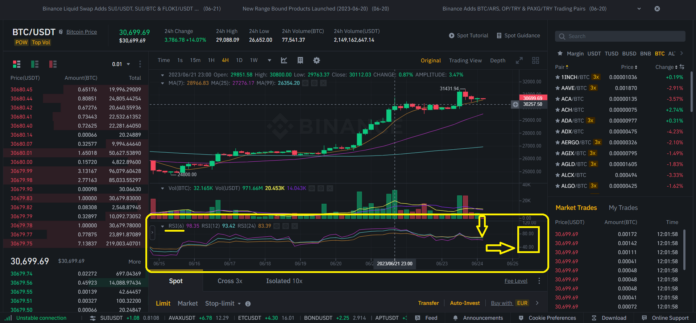
For example, the image below is the RSI on Binance. The yellow box shows the RSI. The yellow arrow on the right shows the indicators. There is another yellow arrow pointing down. This shows the current level at 70. This indicates that a pullback is likely.
Where are we in the bear market?
In November 2022, the FTX disaster occurred. Many investors lost their holdings. There was a general sense of capitulation and it started. At that moment, another metric showed some interesting results. This was the Adjusted MVRV Rate. This metric or TA tool measures unrealized losses in the active market. By then, it was at an all-time low.
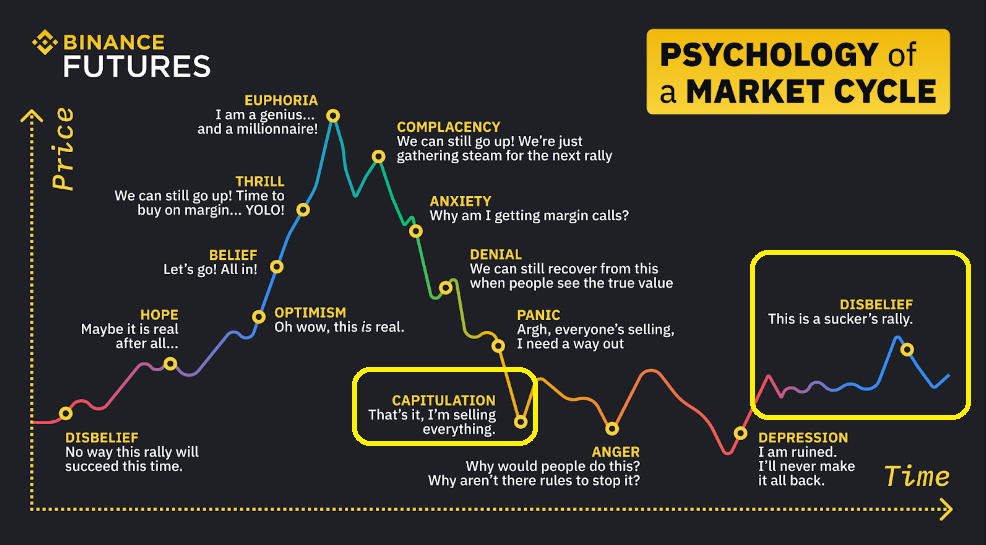
Cryptocurrency bear markets in December 2018 and January 2015 had similar bottoms. There is also the Relative Unrealized Loss metric. It shows the combined loss compared to the total market value. At that time, that rate was 56%. This is a peak similar to what we saw in previous bear markets. So overall, the FTX crash seems to have marked the bottom of this bear market. You can also see this in the psychology of a market cycle chart. We passed the capitulation point. Right now, we may be in the vicinity of the ‘unbelief’ realm. Look at the two yellow boxes in the image below.
All in all cryptocoin.com We looked at whether we had reached the bottom of the cryptocurrency bear market. But we’ve shown you some indicators to get to that answer. We also explained what a bear market is. This puts everything in a broader perspective. So the answer is most likely yes. The FTX crash was most likely the bottom of this bear market. We may be close to the disbelief stage of the psychology of market cycles. This is the last step before a bull run begins.