
Crypto funds recorded the largest capital flow in 2023, with $240,000 inflows in one week. According to analyst Akash Girimath, there is a bullish formation on the charts for the altcoin. Accordingly, the analyst says that the formation indicates a 25 percent rally.
Institutional money flowed into XRP!
cryptocoin.com As you follow, XRP was among the losers this week. However, despite this, institutional investors poured $240,000 into XRP funds last week. Meanwhile, weekly inflows into cryptocurrency funds totaled $199 million, the largest volume since July 2022.
CoinShares analysts announced that after nearly nine weeks of outflows, the inflow to XRP funds has gained momentum. Bitcoin emerged as the largest single beneficiary of inflows with $187 million representing 94% of the $199 million. Entrances to altcoins with smaller market caps are small compared to XRP.
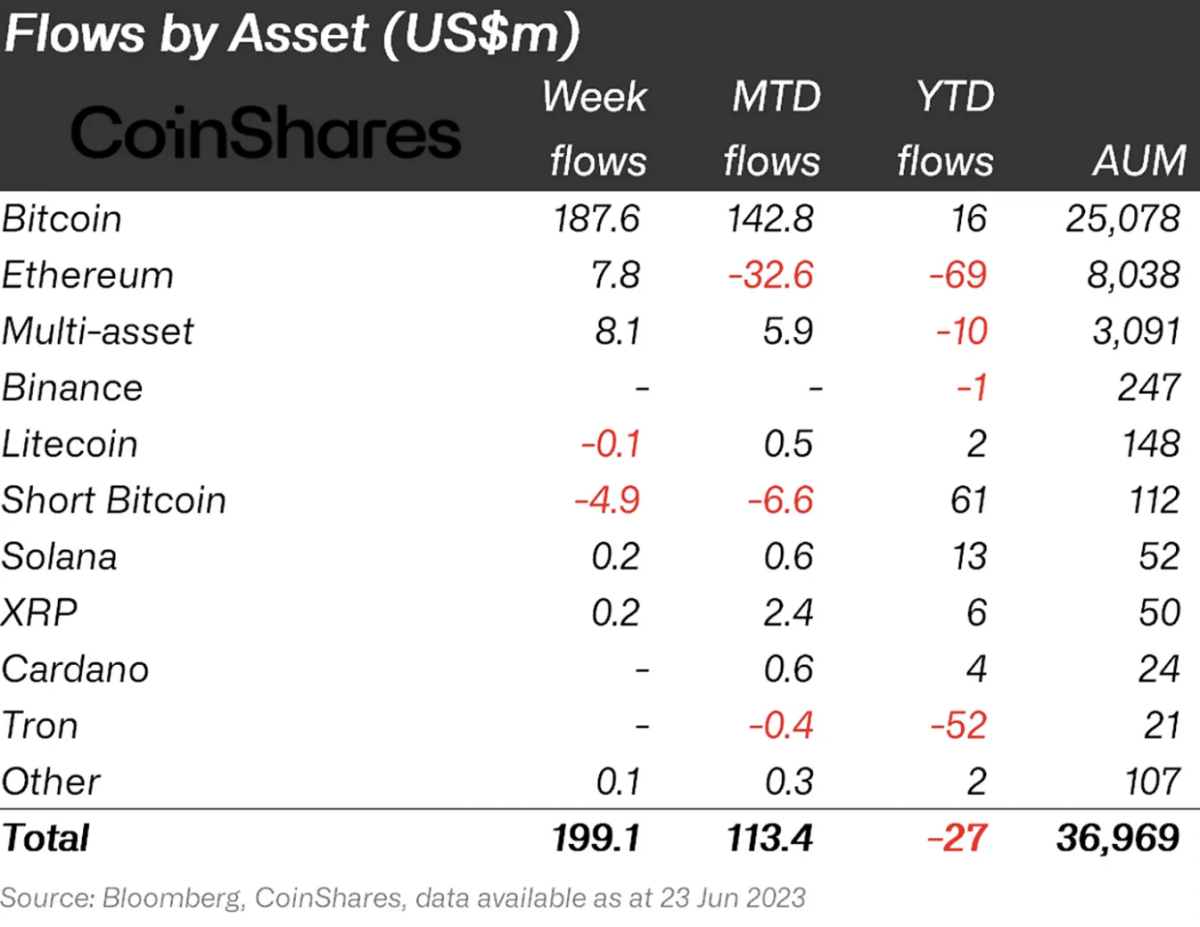 Fund inflows by asset
Year-to-Date (YTD) flows in XRP funds are $6 million. These funds have $50 million in Assets under Management (AUM). Access to XRP funds is important as the altcoin price drops on a weekly basis. On June 19, XRP price was $0.4942 and dropped below $0.4900 on Tuesday. Despite the drop in XRP price, sentiment among institutional investors is largely on the rise. This is most likely due to the possibility of a rally in the altcoin.
Altcoin price and reverse ‘head-and-shoulder’ pattern history
XRP price has formed an inverted head and shoulders setup on the three-day chart in 2019 and 2020. The breakout from this technical pattern initially resulted in a rise of around 190%. After a complete pullback and retest of the neckline, the XRP price rose 607% between March and April 2022.
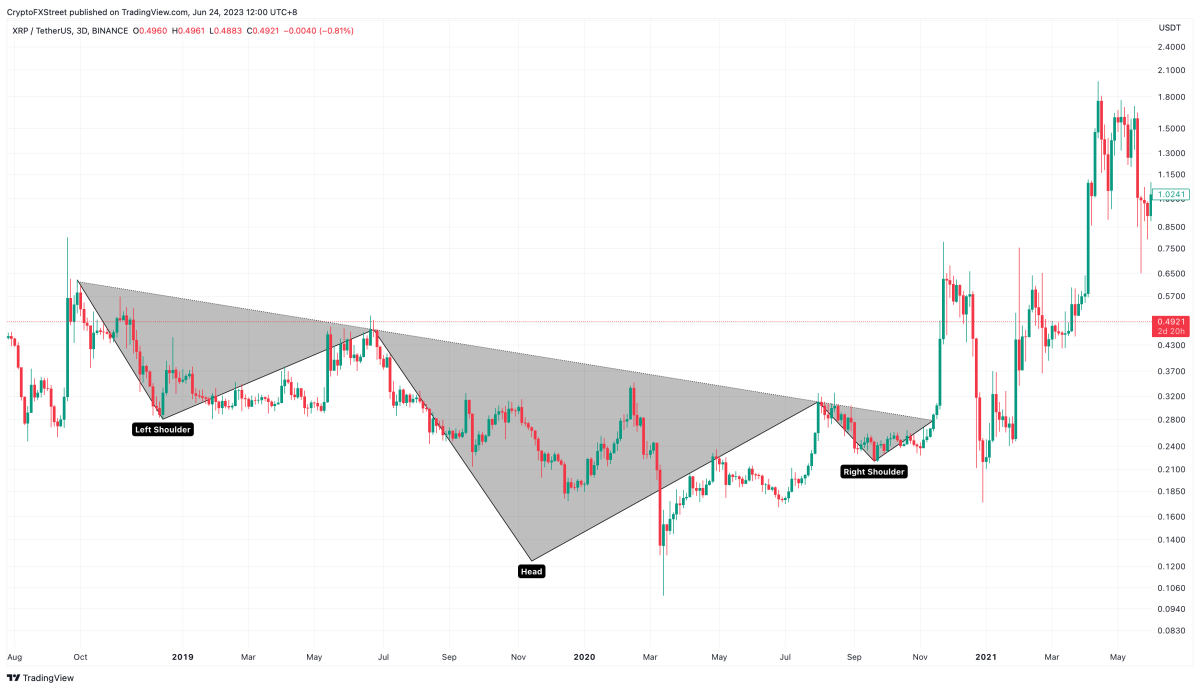 XRP 3-day chart
The most recent example of a reverse head and shoulders setup was in May 2023. After a decisive break above the neckline on May 26, XRP price surged 12% to hit the predicted target at $0.525.
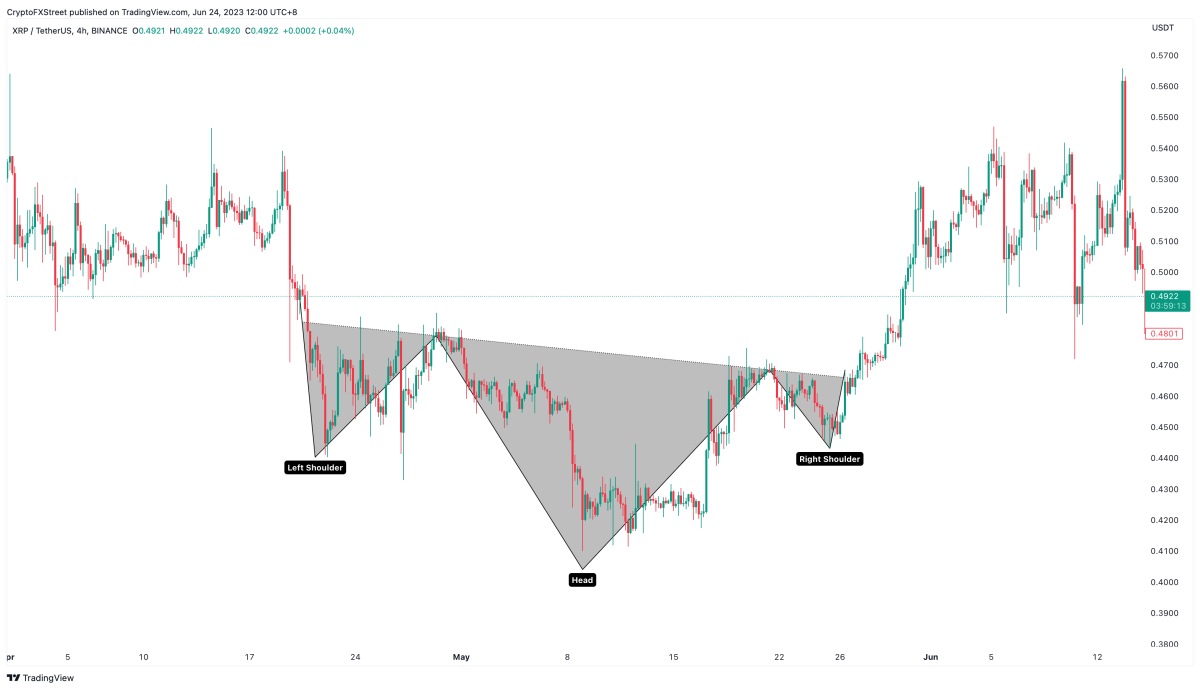 XRP 4-hour chart
Altcoin gearing up for the next big move
XRP price formed an inverted head and shoulders setup on the daily time frame. Price action from late March to June 24 shows three different low swings. In Ripple’s case, the setup predicts a 24.33% rise to $0.673.
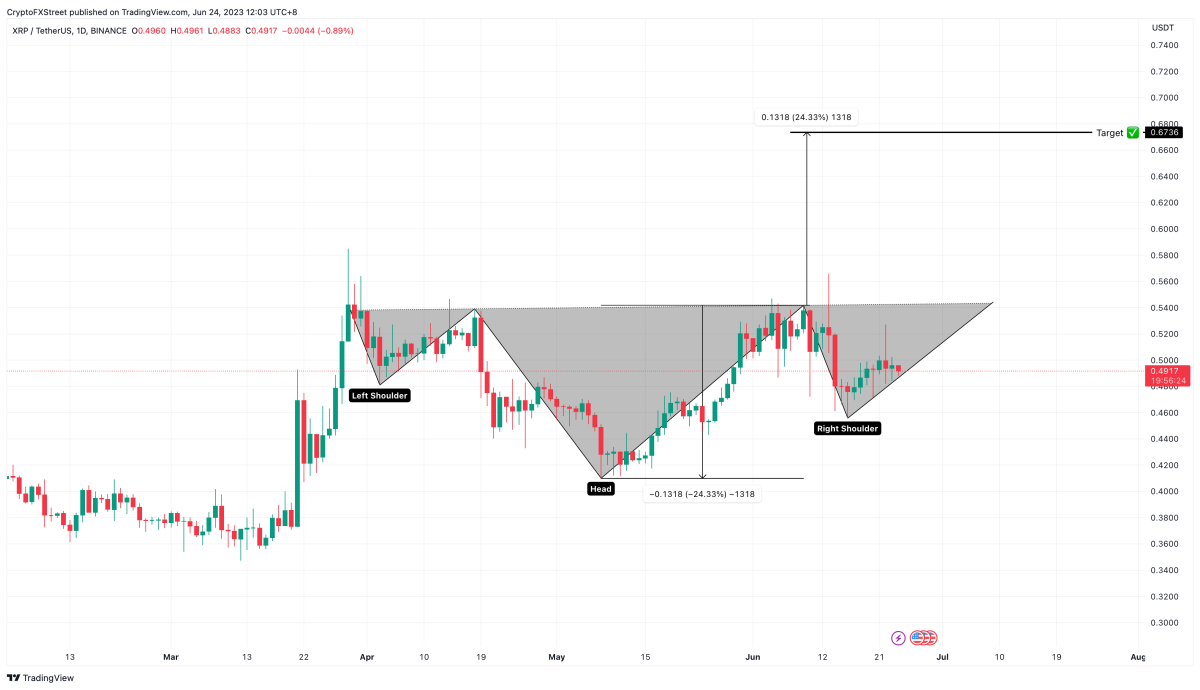 XRP 1-day chart
Considering that the XRP price is still forming the right shoulder, it is too early to say whether this potential bullish setup will be complete. Failure to form the right shoulder and rise above the neckline will mean a weak uptrend for XRP. Should the altcoin sink below the low of $0.455 on June 16, the bullish thesis will be invalidated. Such a move could potentially trigger a 12% correction that retests the May 8 low at $0.410.
XRP continues to rise, experts say
According to crypto analysts at Egrag Crypto firm, XRP price is on the verge of exiting the Multi-year Ascending Triangle (MYAT). Meanwhile, the success rate of the analysts’ forecast is 72.77%. According to statistics, a predicted breakout date in July is approaching. Analysts use the inverted hammer pattern as a signal to determine that the July breakout is in the marking phase.
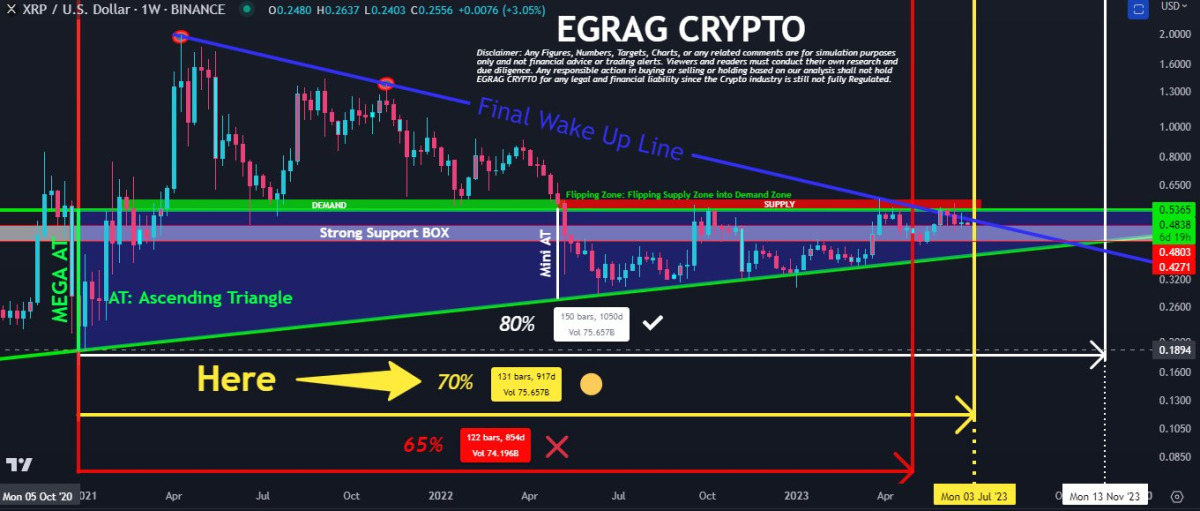 XRP bullish break prediction
Meanwhile, the selling pressure on XRP is weakening. Also, experts note that new buyers appear on exchanges. Short-term support targets are $0.48, $0.46 and $0.42. Short-term resistance levels are $0.50, $0.53, and $0.58.