We focus on the gold and Bitcoin chart of the week. Gold price is stuck in a tight spot ahead of Friday’s bearish opening. Bitcoin, on the other hand, moved in a range of $1,500 last week. So what will happen next? Let’s look at our article.
There is a range in the price of gold
Before the opening of last week, we made important evaluations for Gold. Accordingly, we determined the resistance points and the support points. In our article, we pointed out that the 1983 dollar was the resistance point. On the other hand, we pointed out that the $1925 level is an important support point. An important point here was a short squeeze event.
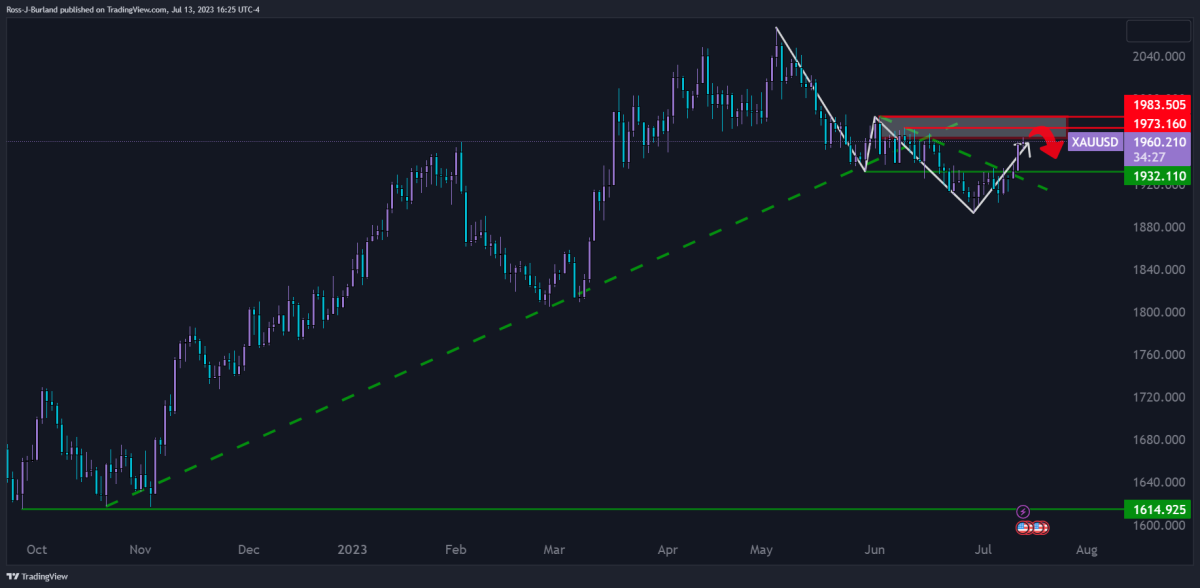
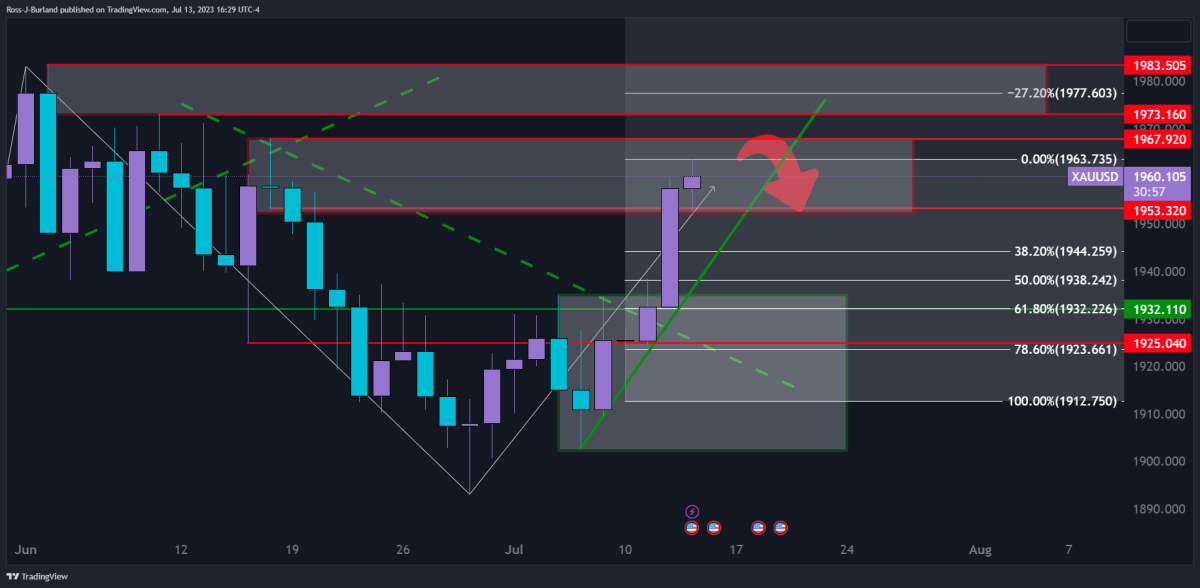
On the daily charts, it seems that the price for gold is currently in a resistance area. This also indicated that the gold price may be on the verge of a correction. The 61.8 Fibonacci retracement area is seen as support at the $1,932 level.
Gold price update
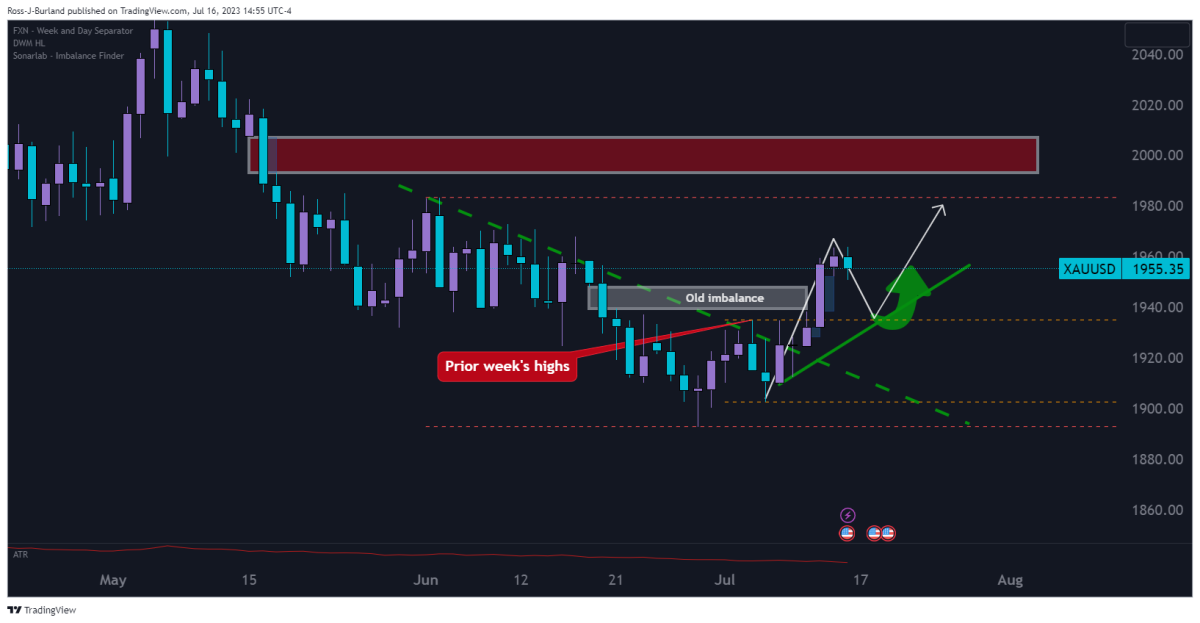
Last week’s gold price high will be the first downside target, as previously announced, before the next significant rise. If the short squeeze continues, then last month’s highs can be seen to the upside.
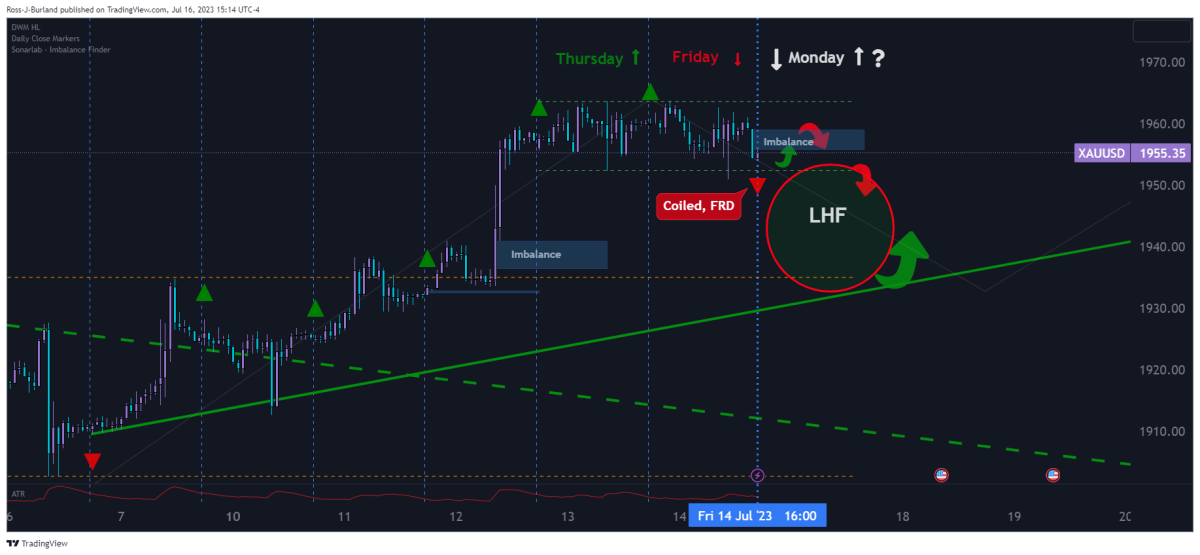
The gold market is stuck between Thursday’s highs and lows. A breakout is also expected. We have an upward price imbalance. This will see the Gold price rise before the downside of the thesis emerges.
We can see Friday closing as First Red Day (FRD) in a series of high closes since Friday, July 7th. This leaves the downward Low Hanging Fruit (LHF) vulnerable for the opening and first balance of the week.
Bitcoin chart
Bitcoin attempted to break out of its tedious sideways price action on July 13 after Ripple’s legal victory over the United States Securities and Exchange Commission. But the enthusiasm proved to be short-lived. Sellers pulled the price back into the range on July 14, showing that they remain active at higher levels. However, the fact that the bulls have kept the price of Bitcoin above $30,000 is a positive sign.
cryptocoin.com Looking at it as a whole, it is expected that market watchers will closely follow the review process of various exchange-traded fund (ETF) offers for the spot Bitcoin ETF, one of the most important of which is BlackRock’s offer. Interestingly, out of 550 ETF applications by BlackRock, only one was rejected, according to Eric Balchunas and James Seyffart of Bloomberg Intelligence.
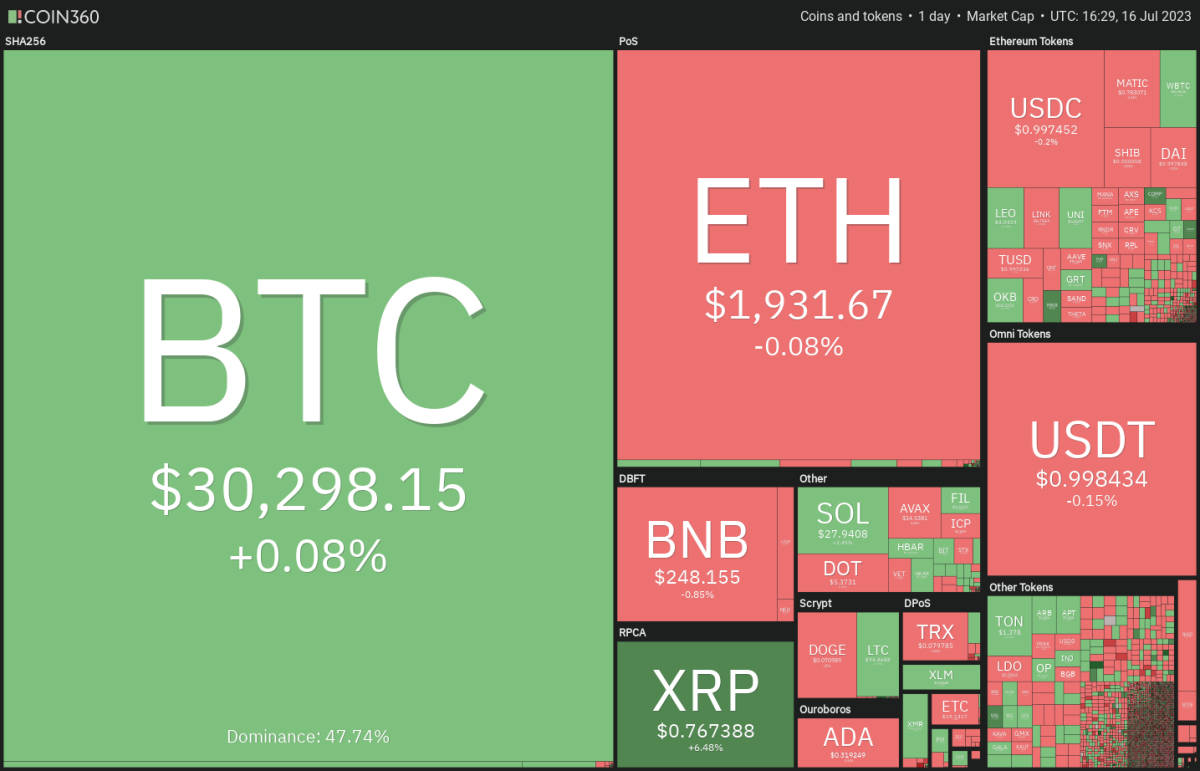
Even as Bitcoin consolidates and awaits its next catalyst, a few altcoins are witnessing solid buys. This indicates that the focus may shift to altcoins in the near term, pulling Bitcoin’s market dominance below 50%.
Bitcoin price analysis
Bitcoin closed above $31,000 on July 13. However, the bears pushed the price back below the level on July 14. Therefore this proved to be a bull trap. This shows that the bears are fiercely defending the region between $31,000 and $32,400.
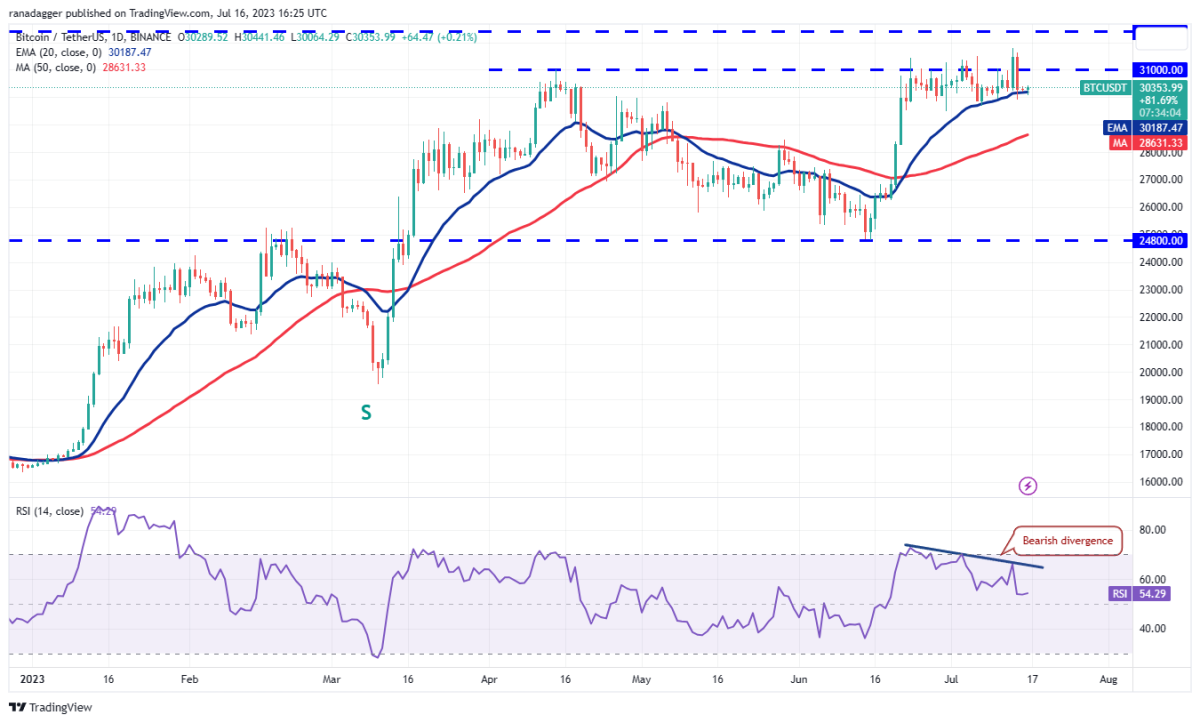
The price action of the last few days has created a bearish divergence in the relative strength index (RSI). This indicates that the bullish momentum is weakening. The bears will try to leverage their advantage by pulling the price below the 20-day exponential moving average ($30,187). If they do, the BTC/USDT pair will move to the 50-day simple moving average ($28,631).
If the bulls want to block the decline, they will need to quickly push the price above $31,000 and sustain it. The pair will later come to $32,400. A break and close above this level will open the way for a potential run to $40,000 as there is no major resistance in between.
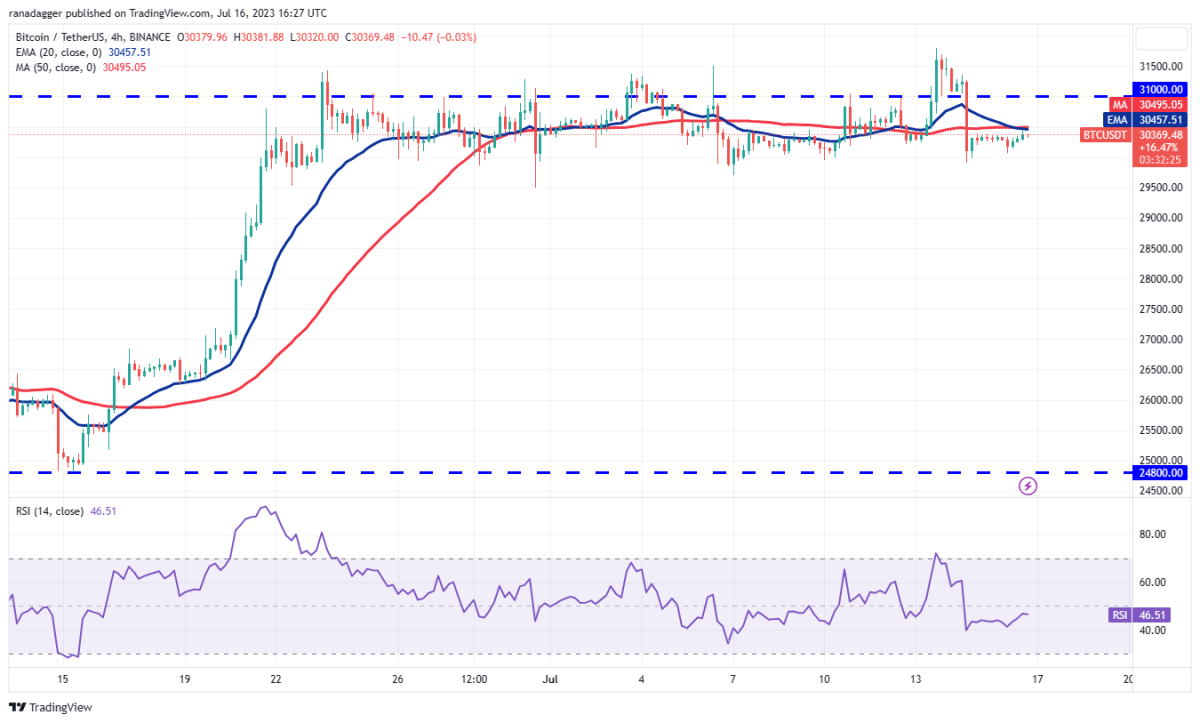
The pair dropped below the moving averages on the four-hour chart. It also shows that demand is drying up at higher levels. The bears will need to push and sustain the price below $29,500 to start a deeper correction. The pair will later fall as low as $27,500. Alternatively, the bulls will need to push and sustain the price above $31,000 to start a bullish move towards $32,400. If the price drops from $32,400 but recovers from $31,000, it will indicate that the bulls have turned the level to support. The pair will then start a rally towards $40,000.


