Economic data from the largest consumer, China, was lackluster, raising concerns about demand. Also, investors are largely betting that the Fed will soon put the brakes on its rate hike trajectory. Therefore, gold prices declined on Monday. Analysts interpret the market and evaluate the technical outlook of gold.
This situation can reduce the demand for gold!
The data showed that the Chinese economy grew at a weak pace in the second quarter as demand weakened. This has increased the pressure on policymakers to provide more incentives to support activity. Vandana Bharti, vice president of commodities research at SMC Global Securities, says more purchases of riskier assets such as base metals and equities could reduce demand for gold, in hopes of stimulus measures in July or August. “Otherwise, we expect a range move with an uptrend below,” Bharti says.

Important technical levels in gold price
cryptocoin.com As you follow, last week the US CPI increased at the slowest rate in more than two years. This indicated a downward inflationary trend. Markets expect the Fed to increase substantially at its meeting on July 25-26. However, he predicts it will likely stop here before next year’s cuts. This pushed gold prices to the highest level since June 16 on Friday. Also, yellow metal had its best week since April. Matt Simpson, senior market analyst at City Index, comments on the impact of the developments on gold:
Gold’s post-CPI rally paused for a breather. This technically leaves the potential for a pullback towards the $1,940-1,950 region. If peak cycles are close, this is another supportive feature for gold alongside central bank buying.
According to Reuters technical analyst Wang Tao, only a break above $1,961 could confirm the continuation of the uptrend towards the $1,971 to $1,977 range.

watch for gold priceyou will eat key levels
Market analyst Anil Panchal uses the Technical Confluences Detector (TCD) for the technical view of gold. Accordingly, gold price remains well beyond the key support confluence of 10-day SMA and 61.8% one-week Fibonacci, around $1,935 by press time. However, the Pivot Point S2 one-day and 38.2% one-week Fibonacci highlight $1,945 as close support that gold sellers should watch as the quotation drops further.
Gold’s weakness above $1,935 leaves it vulnerable to a decline towards the $1,900 round figure. This situation should be noted. However, the monthly low of around $1,893 is likely to challenge the golden bears later. Meanwhile, the 50-day SMA joins Fibonacci 38.2% in one day, suggesting $1,960 as a close resistance for gold. Following that, on the four-hour chart, the upper band of Bollinger, the one-month R1 Pivot Point and the one-day Fibonacci 161.8%, around $1,972, could challenge the rise of gold.
With gold buyers holding the reins above $1,972, the confluence of Pivot Point one-week R1 and Pivot Point one-day R3 around $1,978 appears to be gold sellers’ last defense before fueling the bid towards the psychological magnet of $2,000.
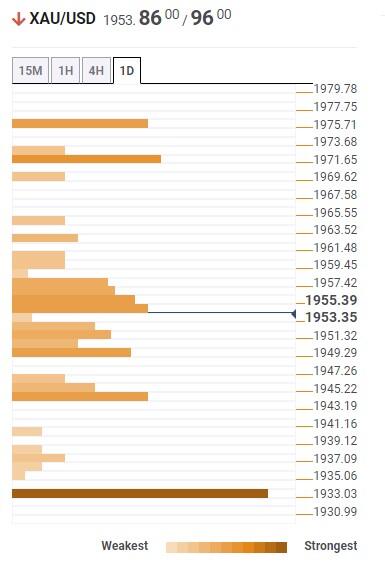 Technical Confluences Detector (TCD)
Gold continues to target 1980 dollars
According to preliminary data from CME Group, open interest in the gold futures markets decreased by around 6.4K contracts after two consecutive days of gains at the end of last week. Volume followed this decline. Thus, approximately 14 thousand contracts were reduced. This is in addition to the previous daily decline.
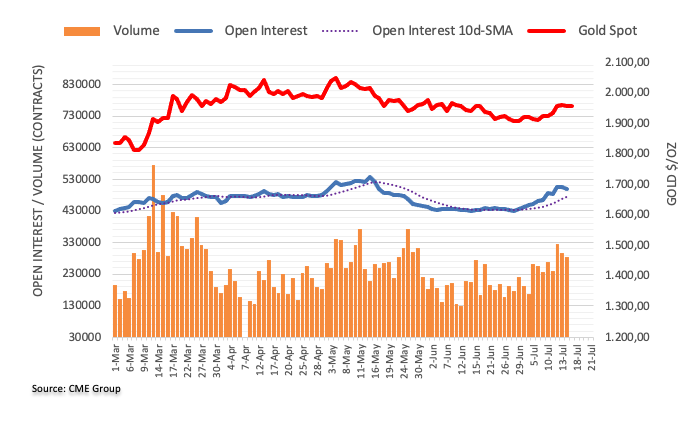
According to market analyst Pablo Piovano, the small drop in gold prices on Friday was due to the contraction in open interest and volume. This allowed some recovery in the short term. Accordingly, the analyst expects the precious metal to aim for peaks just above the $1,980 level in early June.
Yellow metal loses momentum above $1,950
Market analyst Lallalit Srijandorn assesses the impact of recent developments on the price of gold. The gold price is struggling to gain traction. Accordingly, Friday’s retracement from $1,965 extends the decline. The precious metal is currently trading around $1,950 after mixed Chinese data.
Preliminary data of the University of Michigan (UoM) Consumer Confidence Index rose from 64.4 to 72.6 in June. Thus, it exceeded the market’s expectation of 65.5. In addition, US consumer prices fell from 4.0% to 3.0% year-on-year, while the Producer Price Index (PPI) fell from 0.9% to 0.1%. Market participants expect the Fed to raise interest rates at its July 26 meeting. However, he predicts that it will then become less hawkish in tightening monetary policy. It’s also possible that this could be a headwind for the US Dollar. Hence, it is likely to form a bearish cap for gold.

On the Chinese front, the latest National Bureau of Statistics (NBS) data reported that China’s Gross Domestic Product (GDP) came in at 6.3% year-on-year, lower than previously estimated at 7.3% and 4.5%. At the same time, Industrial Production rose to 4.4% from 3.5% the previous year, exceeding the consensus of 2.7%. In addition, Retail Sales decreased to 3.1% from 12.7% YoY compared to June. The market expectation was 3.2%. Mixed economic data helped gold limit its losses. However, investors continue to focus on Chinese data. It should be noted that the fear of economic slowdown in China could have a negative impact on the gold price as China is the largest gold consumer.