Bitcoin started a fresh increase and surpassed $31,000. According to technical analysis by NewsBTC’s Aayush Jindal, BTC could correct gains but dips could find support above $30,800.
Bitcoin Up 5%
Bitcoin continued to trade well above the $30,000 pivot level. It formed a base and started a fresh increase above the $30,500 resistance zone. It gained momentum above the $31,200 resistance zone and settled well above the 100 hourly simple moving average. Finally, there was an increase above the $32,000 level and the price traded as high as $32,186. It is now correcting gains below $32,000. There was a move below the 23.6% Fib retracement level of the upward move from the $30,234 low to $32.186 low
. However, there is a connecting bullish trend line forming with support near $31,250 on the hourly chart of the BTC/USD pair.
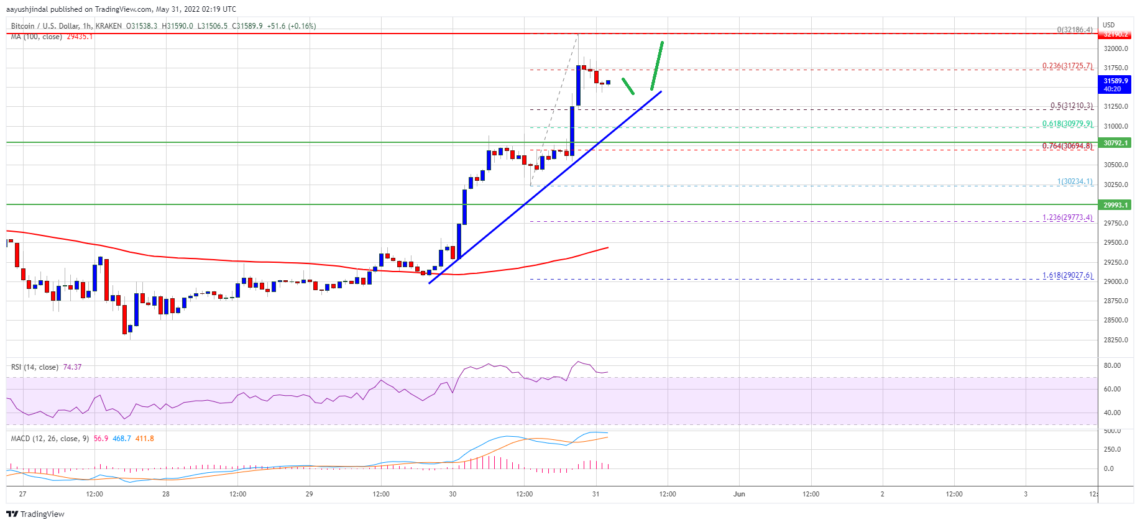
An immediate resistance is near the $32,200 level. The next major resistance is near the $32,200 level. A clear move above the $32,200 resistance level could open the door for another rise. In the indicated case, the price may even surpass the $32,500 resistance. The next major resistance is near the $33,400 level.
Will Bitcoin Drop?
Jindal says that if Bitcoin fails to break past the $32,200 resistance zone, it could start a downside correction. An immediate support is near the $31,500 level. The first major support is near the $31,250 level and the trend line. This is close to the 50% Fib retracement level of the upward move from the $30,234 high to $32,186 high.
The main support is currently forming near the $30,800 level. A downside break below the $30,800 support might put a lot of pressure on the bulls. In the stated case, the price could revisit the $30,000 support zone in the near term.
What Do Technical Indicators Say?
- Hourly MACD – The MACD is now losing momentum in the bullish zone.
- Hourly RSI (Relative Strength Index) – The RSI for BTC/USD is currently well above the 60 level.
- Major Support Levels – 31,250 followed by $30,800
- Major Resistance Levels – 32200, 32200 and 33400