First of all, let’s look at the price in the 18-hour time frame with a clear eye.
After the falling break in the price structure formed from April 14 to June 20, the price increased up to the maximum level of $31800.
Instantly, the price retraced to $29250 levels, now let’s see what can happen from here.
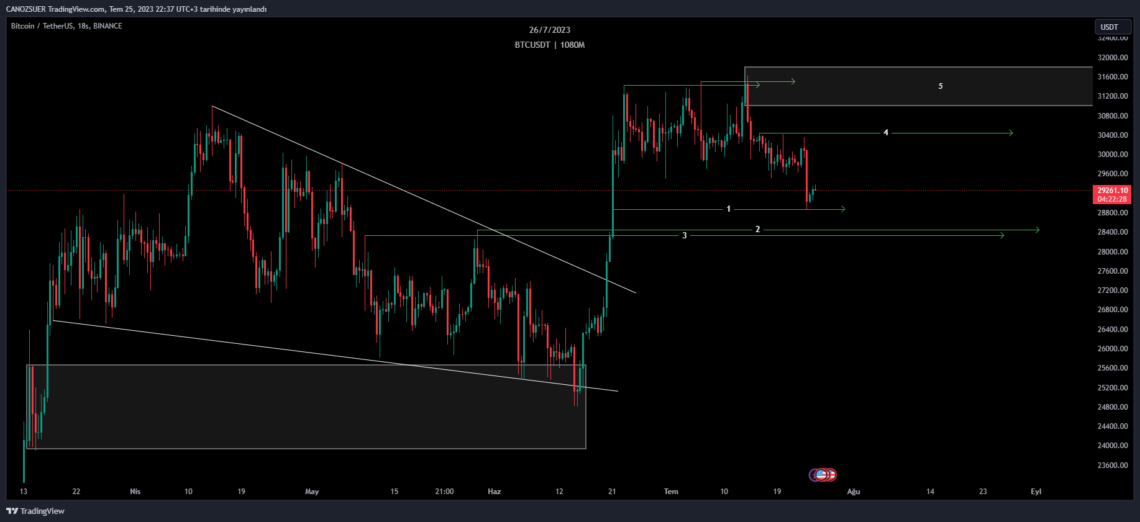
I have numbered the regions that may be important in the price as 1-2-3-4-5, respectively, so I would like to explain the situation in a way that will not confuse you with terms.
If the price’s permanence becomes clear after the decline in area 1 on the 4-hour chart, the levels I expect to reach will be areas 4 and 5.
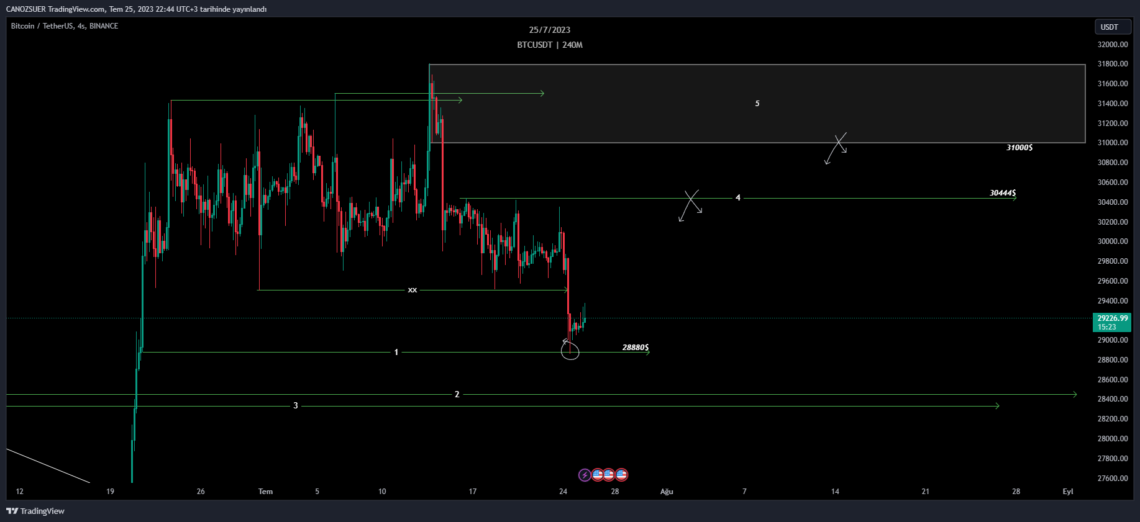
However, if the price closes below area 1, a decrease may occur up to areas 2 and 3.
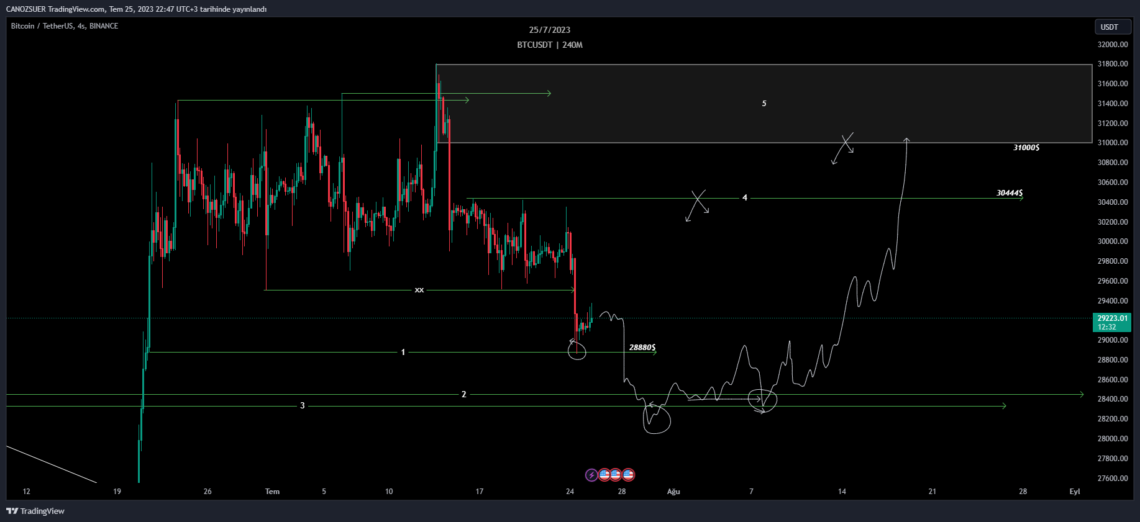
In this case, we can set up 2 different strategies for the price to reach areas 4 and 5.
If the first one is to wait for areas 4 and 5 unless candles are closed below area 1, and the other is to close candles below area 1, a price structure can be expected as I have exemplified in the chart and a trading entry strategy can be applied accordingly.
Price will want to test areas 4 and 5, those areas are positioned as expensive zones in my perspective. Zeroing the risk in those areas would be a reasonable choice.