Moving in the same price band for a long time BTC , breaking this area a few days ago, made a sharp decline. With the loss of $ 29,500, the leader of cryptocurrencies, which shot $ 28,880, is currently hovering around $ 29,200. What is the latest status of the chart for BTC, which has not yet clearly turned to resistance and support? Which points can offer clues to the direction of the market?
Bitcoin (BTC) chart analysis
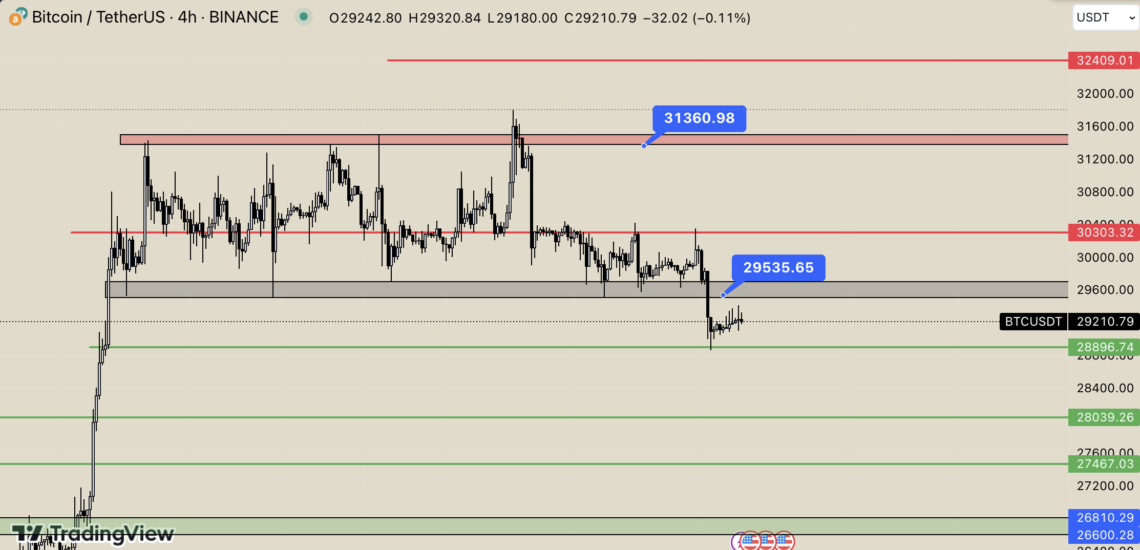
After the support of $ 29,500 could not hold, BTC, which wicked $ 28,900, is currently trading at $ 29,210. In order for the market to catch a positive atmosphere, the critical region that BTC must exceed is $ 29,600. Hovering above this resistance could open the door for further rises towards $30,300 – 31,360 and $32,400.
Continuing the dominance of sellers or sector-based FUD news could push the price down further. In such a possible situation, the support points to be followed are 28,900 – 28,040 – 27,460 – 26,600 dollars, respectively. The failure of $26,600 to be held by buyers could bring the contacts to $25,200.