The 5 altcoins, which have been trading at the confirmed support levels of recent months, are laying the groundwork for a ‘bull burst’ in the coming days. Technical analysts looking at historical data especially draw attention to BNB and XLM charts…
These 5 Binance-listed altcoins are trading in the opportunity zone
BNB Coin (BNB)
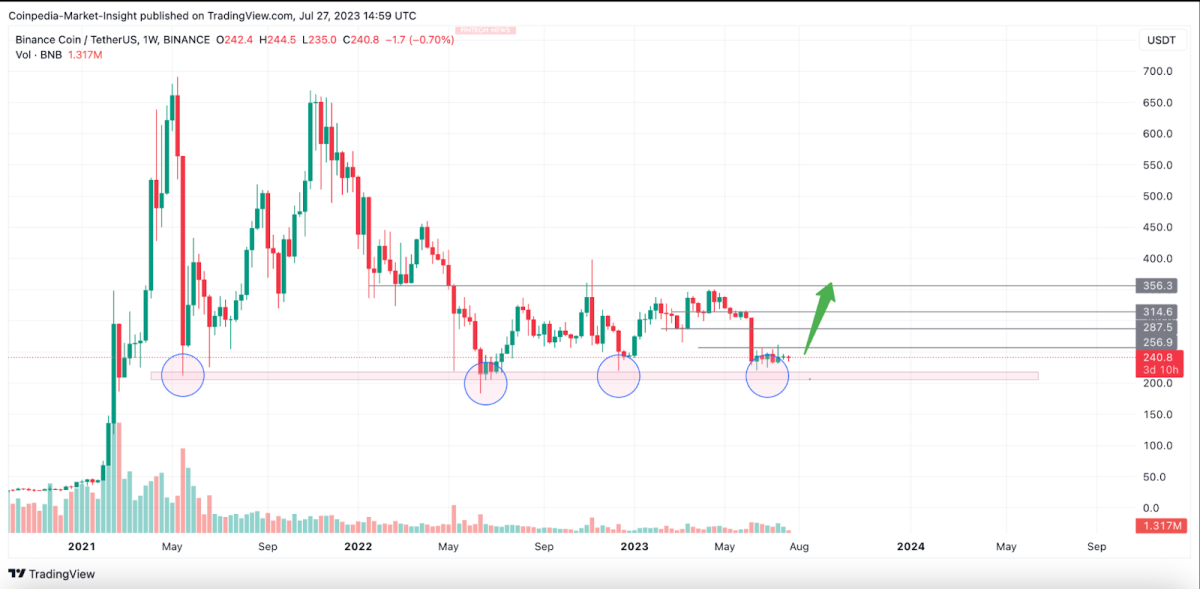
BNB Coin price is testing an area that has proven extremely strong in several cases. Each time the price tested the $225 zone, bullish price action followed. Therefore, if it follows a similar price action right now, the next target will be $325 to $335, up around 40% to 50%. Therefore, a long position is targeting $258.3 with the first target at $258.3 followed by higher targets at $2232.5 as shown in the chart below. BNB is currently trading in the $240 region.
Chainlink (LINK)
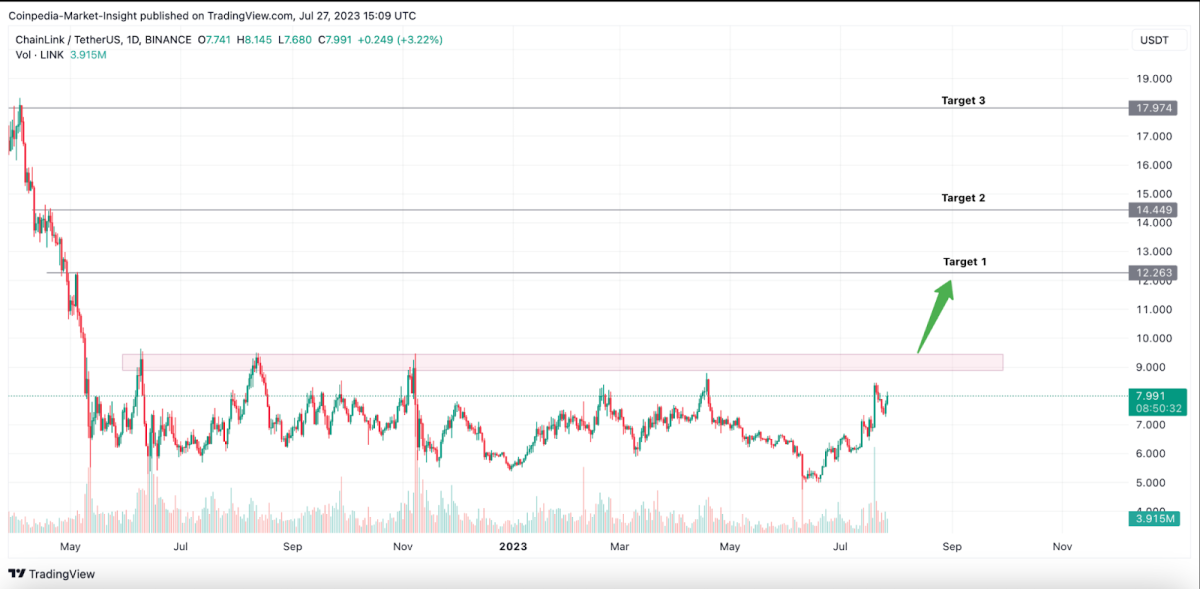
Throughout the year, LINK has traded very steadily between $5.5 and $9. It is currently gathering strength above $8. The real question here is whether the price can stay above the resistance this time after multiple failed attempts. Therefore, a daily close above $10 will clarify the uptrend. Considering the LINK price has been flat for nearly a year, expectations for explosive action are rising.
Stellar Lumens (XLM)
In the past two months, XLM has stood out in terms of market cap and price gains. It has managed to record a remarkable 110% price increase from bottom to top in the last eight weeks. However, recent trends suggest that the bullish momentum behind XLM is weakening.
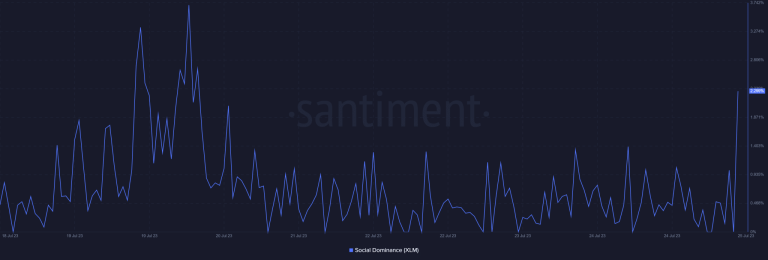
Despite recent trends, trading volumes remain significantly above the monthly low. This indicates continued market interest. Additionally, a slight increase in sentiment weighted from Santiment’s data points to bullish optimism. The social dominance metric, which has been on the rise lately, is gaining a lot of attention due to Stellar’s recent expansion to the Changera App.
Moreover, Stellar continues to expand its market dominance, as announced on the official X account. The Stellar-based USD Coin (USDC) stablecoin is now available at 322,000 off-ramp locations. This availability is far greater than that of USDC on Ethereum, which only has 30,180 locations.
The Stellar network leads total off-ramp locations by asset 🏆 #RampUpWithStellar
Read the report: https://t.co/wHUsweWN0K pic.twitter.com/haOoJRq64r
— Stellar (@StellarOrg) July 26, 2023
Technically, XLM dropped below the 50-day EMA and approached the horizontal support line at $0.14. However, the bulls saw this as a lucrative opportunity to dive in. They stepped in and bought the dip and pushed the price above the 50-day EMA line. XLM price continued to rise above multiple Fib channels. The price is constantly approaching the critical resistance line as it recently surpassed $0.16.
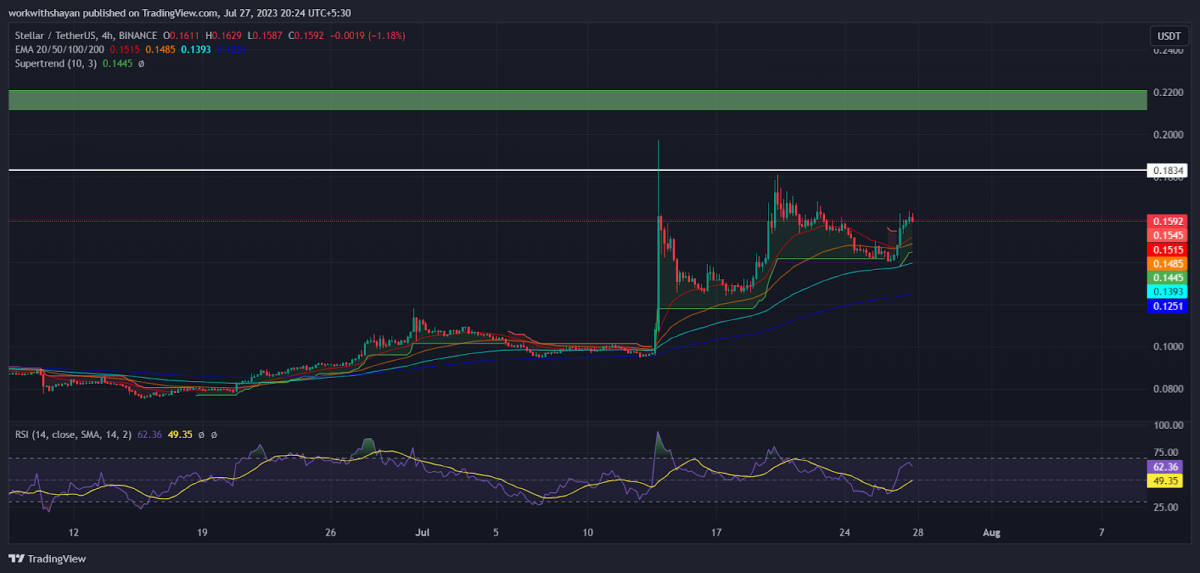
If the buyers manage to maintain the current uptrend and push XLM price above the critical resistance line at $0.183, more longs are likely to be opened. This will test the upside channel pattern between $0.21 – $0.22. The ascending EMA20 trendline and the RSI in the positive zone indicate a potential breakout momentum ahead. However, if XLM price breaks below the $0.138 support level, a serious bearish divergence is likely to occur. This leads to a consolidation around $0.125.
XRP
Over the past two weeks, XRP has experienced a period of correction following the macro break earlier this month, leading to expectations of a new bullish phase. This optimistic outlook is due to the increased listings and trading pairs on crypto exchanges supporting its overall liquidity.
Analyst Crypto Tony says that XRP bulls should successfully flip the resistance zone at around $0.726 to support. Once this exchange is confirmed, it will lay the groundwork for a position that is expected to emerge in the coming days.
Ascending triangle pattern for the win. 50% pump and breaking out heavily from the resistance zone. Big win today for the space and the markets ..
Crypto is BACK 💯 https://t.co/Kyu3X7XkDH pic.twitter.com/uqcGwFlL0d
— Crypto Tony (@CryptoTony__) July 13, 2023
Meanwhile, while the outlook for XRP looks positive, a degree of uncertainty remains. This requires investors to be careful. Crypto Tony states that the position in question will be invalidated if the XRP price drops below the support level of around $0.69.
Cardano (ADA)
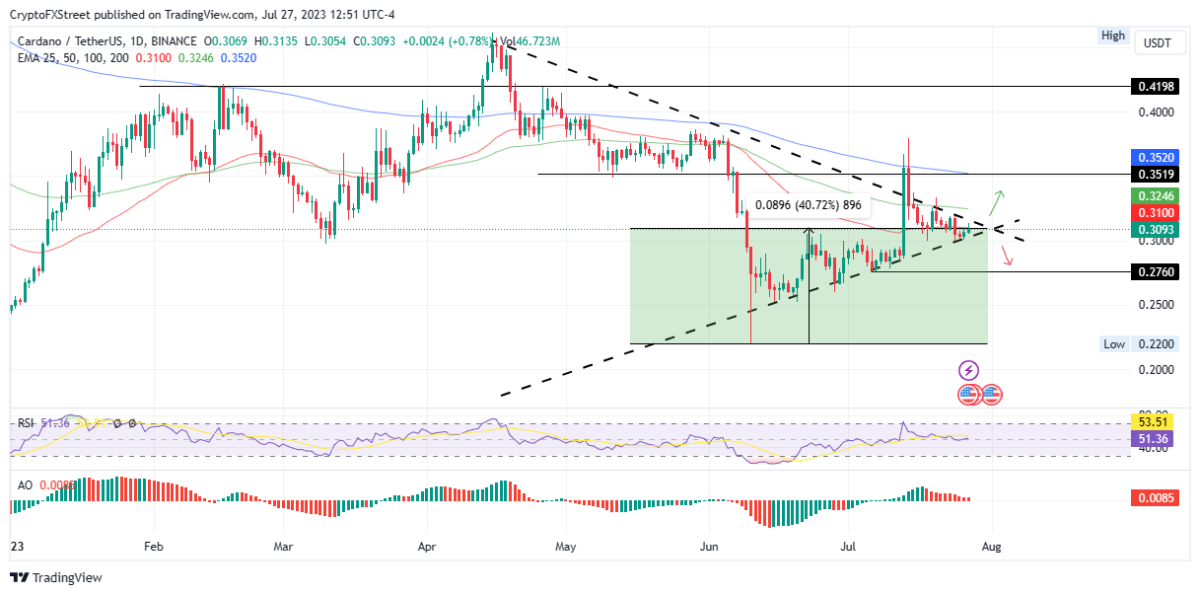
ADA price has managed to stay within an ascending trendline for almost two months. The positive outlook remains valid even though it’s been a long time since the 13th of July Ripple victory.
In terms of price, ADA is up 40% since June 10 while continuing to consolidate along the uptrend line. On the positive side, the price managed to hold on, while investors quickly profited from the short rallies. For example, most of the gains from the 30% increase on July 13 have already been booked. ADA price action now fills a pennant as buyers and sellers struggle with traffic.
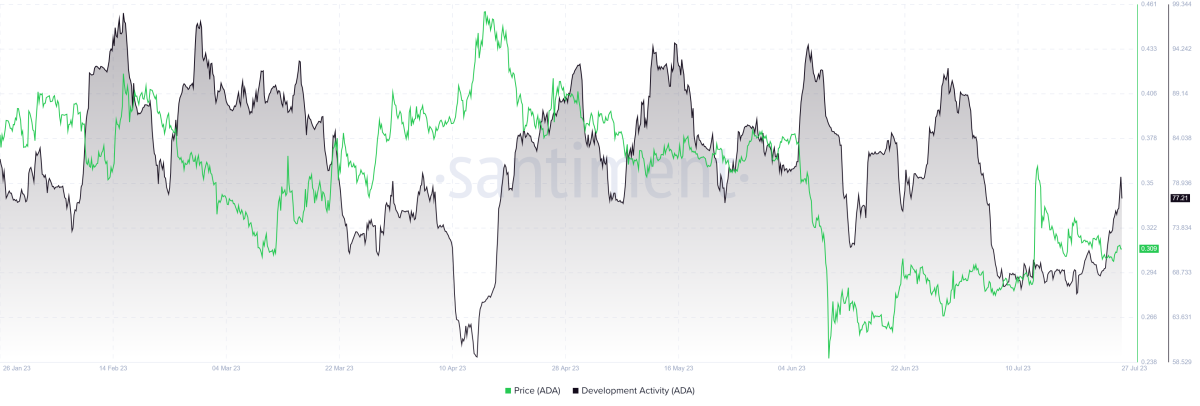
However, the outlook for Cardano price remains bullish. Santiment data shows ADA ranks third in development activity. The performance is commendable, with the altcoin beating Ethereum (ETH), the largest altcoin in market capitalization metrics.
🧑💻 Top 10 #crypto assets by development activity: notable #github commits, past 30 days:
T1 @Polkadot $DOT
T1 @kusamanetwork $KSM
3 @Cardano $ADA
4 @dfinity $ICP
5 @hedera $HBAR
6 @vegaprotocol $VEGA
7 @ethstatus $SNT
8 @cosmos $ATOM
9 @Ethereum $ETH
10 @decentraland $MANA pic.twitter.com/SnWDQf5a3y— Santiment (@santimentfeed) July 27, 2023
In particular, the development activity of the Cardano network recorded several peaks during the year. Since April 14, development activity has increased by 30%. As of July 27, it rose from 59.01 to 77.21. This metric shows the number of pure development-related events on the project’s GitHub.
ADA price prediction
According to the daily chart, if the bullish momentum in the ADA market continues, Cardano price may exit the technical formation. A successful break of the 50-day EMA at $0.30 will clear the hurdles for ADA to reach $0.32. An additional bull run to $0.35 would mean a 15% climb from the current position.
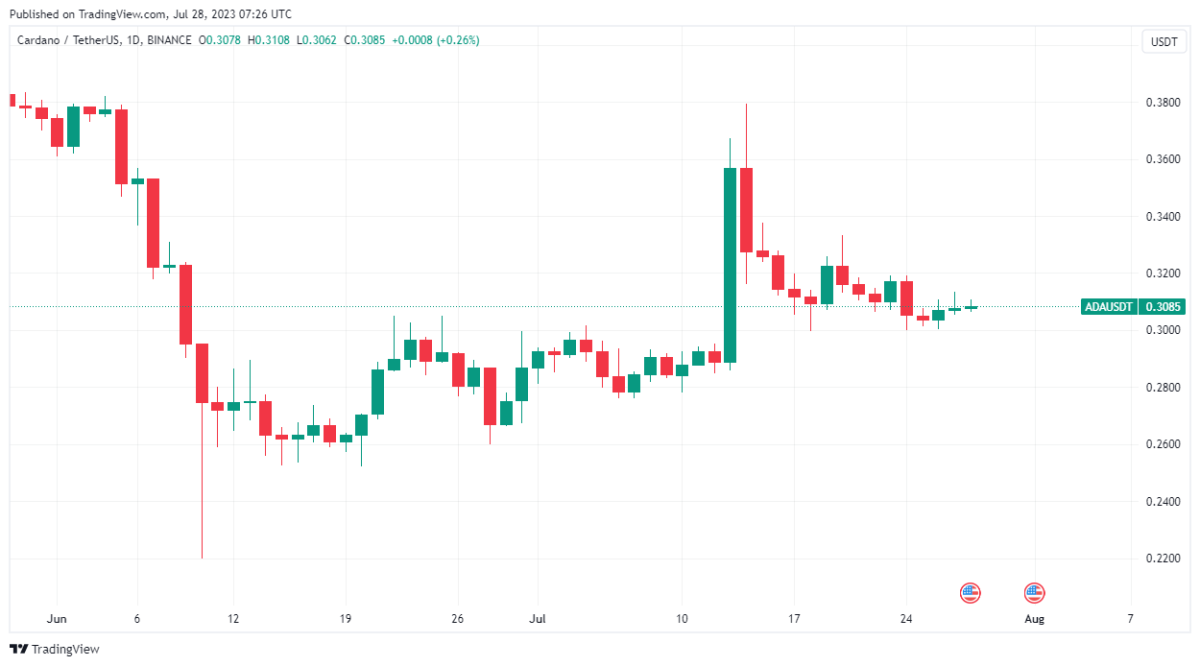
On the other hand, if the momentum subsides, Cardano price could cross the lower border of the triangle in a bearish move. This would potentially widen the downside move, leading to July 7 lows at $0.27. This scenario represents a 10% drop from the current price.

