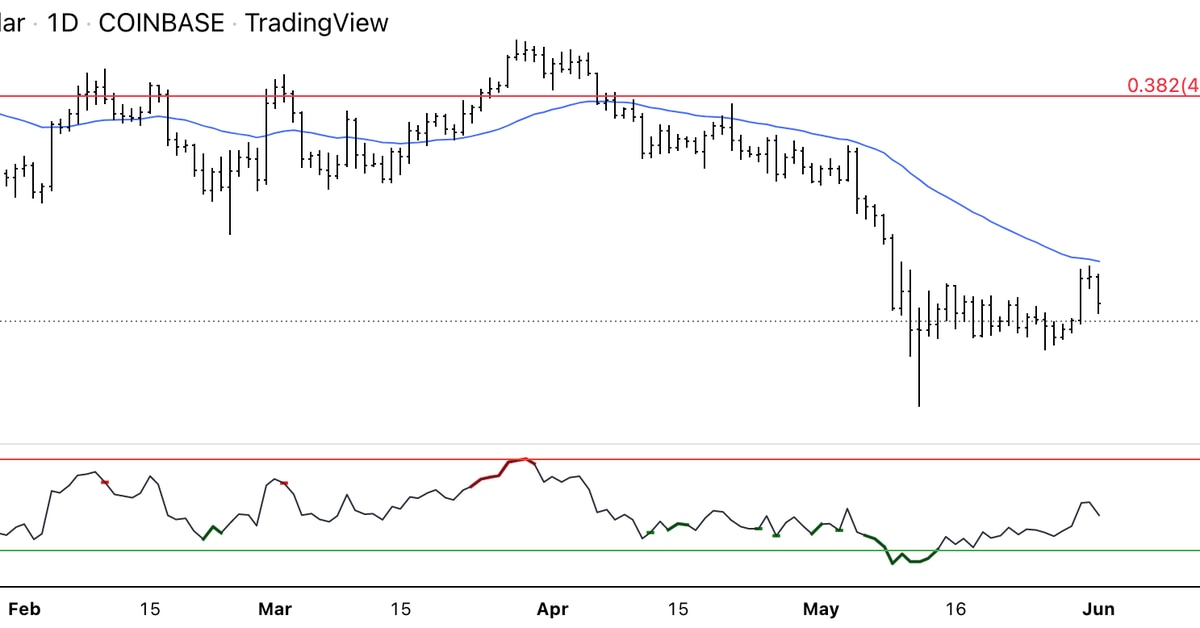
Bitcoin (BTC) pared earlier gains after buyers took some profits below the $33,000 resistance level. The cryptocurrency could find support, initially at $27,500 and then at $25,000.
The relative strength index (RSI) on the four-hour chart reached oversold levels on Monday, which preceded the current pullback in price. And on the daily chart, the RSI returned below the 50 neutral mark, indicating a temporary loss in upside momentum.
On the weekly chart, bitcoin appears to be oversold, albeit with negative momentum signals. That suggests upside could be limited beyond $35,000.
For now, BTC is roughly one week away from registering a downside exhaustion signal, which previously occurred on June 7 of last year and on January 10 this year. Still, a weekly close above $30,000 is needed to confirm a bullish short-term signal.
If further breakdowns occur, secondary support is seen at $17,673.
Read more about
Save a Seat Now
 BTC$30,332.33
4.65%
 ETH$1,843.20
5.24%
 BNB$304.21
5.22%
 LUNA$0.006801
43.97%
 XRP$0.403487
3.05%
View All Prices
Sign up for First Mover, our daily newsletter putting the latest moves in crypto markets in context.