Bitcoin and certain altcoins are starting to recover. But according to crypto analyst Rakesh Upadhyay, sales at the top of every price break show that the bears are in control. What are the important support and resistance levels to watch out for in altcoins including Bitcoin and DOGE? Analyst analyzes charts to find out.
An overview of the cryptocurrency market
cryptocoin.com As you follow, Bitcoin saw a sharp decline on August 17. After that, it was stuck in a narrow range over the weekend. This indicates indecision between the bulls and bears about the next directional move. According to Glassnode’s weekly newsletter, around 88% of Bitcoin held by short-term holders (STHs) holding Bitcoin for 155 days or less has been lost since the last drop. Glassnode warns that the STH group is “increasingly price sensitive.” In contrast, long-term owners neither panicked nor went on a shopping spree during the current downturn.
 Daily cryptocurrency market performance. Source: Coin360
Investors will closely follow Federal Reserve Chairman Jerome Powell’s speech at the annual Jackson Hole Economics Symposium on August 25. If Powell doesn’t give a negative surprise, it’s possible that the event could turn into bullish for risk assets. Because history shows that U.S. stocks generally rose in the week after Jackson Hole.
BTC, ETH, BNB And XRP analysis
Bitcoin (BTC) price analysis
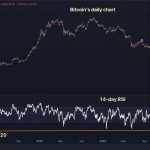
Bitcoin has been consolidating in a wide range between $24,800 and $31,000 for the past few weeks. Within a range, traders buy dips towards support and sell near overhead resistance. In between, trading can be random and volatile.

The moving averages have turned down and the RSI is in the oversold territory. This shows that the bears are under tight control. Sellers will try to increase their advantage by pushing the price below $24,800. But the bulls are unlikely to give up easily. Buyers will try to start a recovery from support that is likely to gain momentum above $26,833. It is possible for BTC to rise to the 20-day exponential moving average (EMA) at $28,098 later. This would indicate that the interval-dependent action remains intact.
Ethereum (ETH) price analysis
Ether bounce is struggling to rise above $1,700. This shows that the bears do not give up and sell in small rallies.

A shallow bounce usually indicates a lack of urgency for buying among the bulls. This increases the risk of a break below the support. If the price declines and dips below $1,626, it will show that bears continue to dominate. It is possible for ETH to retest its intraday low of $1,550 on August 17. Conversely, if the price turns up from the current level and rises above $1,700, it will indicate the start of a stronger recovery. The first stop would likely be the 20-day EMA ($1,777). However, if it crosses this level, ETH is likely to reach the 50-day SMA ($1,852).
Binance Coin (BNB) price analysis
BNB fell below the $220 vital support on August 17. Also, the bears have managed to defend the level since then. This shows that the bears are trying to turn the 220d level into resistance.

The price broke below the close support at $212 on August 21, signaling the resumption of a downtrend. It is possible for BNB to drop first to the $196 formation target and eventually to the next major support at $183. Meanwhile, time is running out for the bulls. If they want to salvage the situation, they will need to quickly push the price above $220 and sustain it. BNB is likely to rise to the 20-day EMA ($230) later. Again, this is likely to act as a rigid barrier.
Ripple (XRP) price analysis
XRP bounced off the strong support at $0.41 on August 17. In this move, it reached the overhead resistance of $0.56 on August 20.
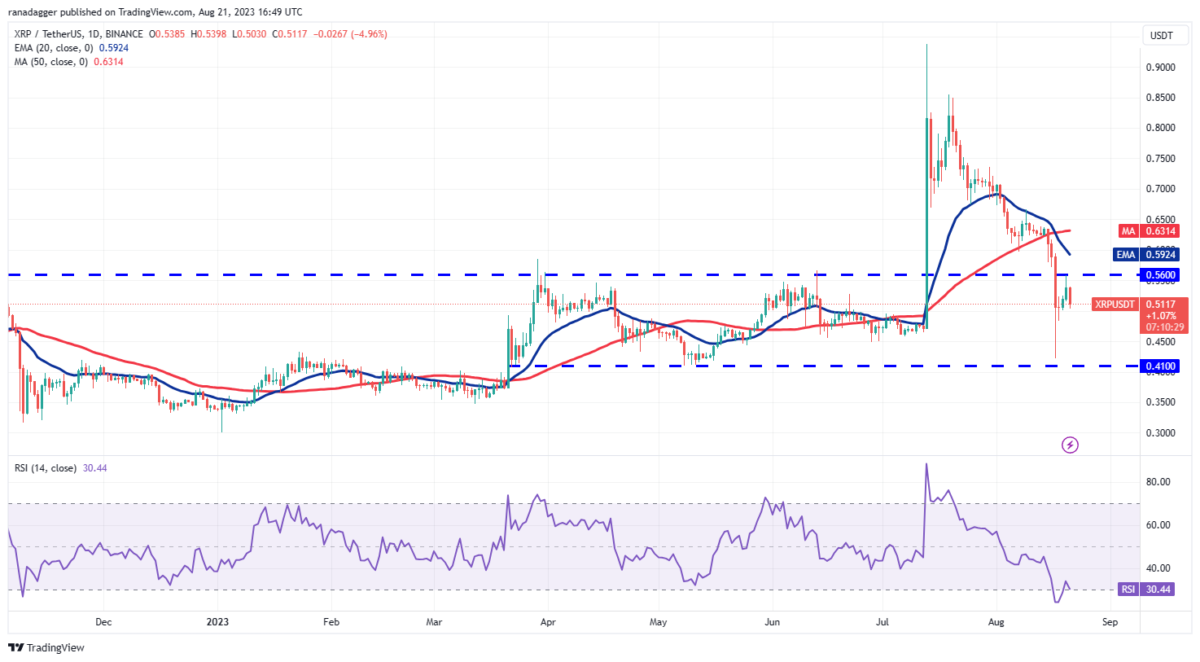
The bears are trying to stop the relief rally around $0.56. This shows that sentiment remains negative and traders are selling on every small rise. If the price drops and dips below $0.48, it will indicate that XRP will oscillate between $0.41 and $0.56 for a few days. The falling 20-day EMA ($0.59) and the RSI near the oversold zone are pointing to the bears’ advantage. The first sign of strength would be a break and close above the 20-day EMA. This will indicate that the bearish pressure is easing.
ADA, DOGE, SOL and DOT analysis
Cardano (ADA) price analysis
Cardano bounced back from the crucial support at $0.24 on August 17. However, the relief rally is facing downside pressure at the overhead resistance near $0.28.

The falling 20-day EMA ($0.28) and the RSI in the negative territory suggest that the bears have the upper hand. A drop below $0.26 will indicate that ADA will oscillate in the narrow gap between $0.24 and $0.28 for a while. Generally, a tight consolidation near a strong support level is a negative sign. Therefore, it may result in a malfunction. If the $0.24 support leaves its place, a drop to $0.22 and then $0.20 is possible for ADA. If buyers want to avoid the drop, they will need to push the price above the moving averages quickly.
Dogecoin (DOGE) price analysis
The bulls have managed to hold DOGE price above the $0.06 key support for the past few days. But they failed to initiate a powerful leap.

The shallow bounce signals a negative sentiment where the bulls are not buying aggressively. It is possible that this has spurred the bears to take control. Thus, they pulled the price towards the strong support at $0.06. If the price dips below $0.06, DOGE price is likely to drop towards the next solid support near $0.05. Alternatively, if DOGE price turns up from the current level, it will indicate that lower levels are attracting buyers. DOGE price is likely to rise to the moving averages later on. A break above the 50-day SMA ($0.07) could initiate a sustained recovery.
Solana (SOL) price analysis
Solana bulls are facing stiff bears resistance near the overhead resistance of $22.30. This shows that the bears are trying to turn the $22.30 level into resistance.

The moving averages have completed the downtrend and the RSI is in the negative territory. This shows that bears have an advantage. It is possible for SOL to retest the $20 support. If it breaks above this level, the SOL is likely to start a deeper correction towards $18 and then $15.60. If the bulls want a reversal, they will have to kick the price above the moving averages. This will be a tough request! If they do, however, the SOL is likely to rise to the overhead resistance zone of $26 to $27.12.
Polkadot (DOT) price analysis
Polkadot created a Doji candlestick pattern on August 19 and 20. Thus, it pointed out that the buying pressure has decreased.

If the price continues to slide below $4.36, it will show that the bears are trying to gain the upper hand. DOT is likely to retest the key $4.22 support later. If it breaks above this level, selling could accelerate and the DOT could start the next leg of the downtrend. Conversely, if the price rises and rises above $4.56, it will indicate that the bulls are making a comeback. It is possible for the DOT to rise to the 20-day EMA ($4.79), which is likely to act as a roadblock again later on.