
August has been a bearish month for the cryptocurrency market. This was evident in both Bitcoin (BTC) and various other altcoin projects. There is hope that the uptrend will reverse in September. However, crypto analyst Valdrin Tahiri says the worst is yet to come for the 4 altcoins.
This altcoin has landed at its lowest price since 2017!
DASH price has fallen since its all-time high of $1,625 in December 2017. Two years later, the price bounced off the $40 horizontal support area (green icon), forming a long lower wick. This started an upward movement. However, DASH price once again entered a downward trend in May 2021. In July 2023, it finally broke the horizontal support area of $40 and reached a low of $23.86 on August 17. This was the lowest price seen since February 2017.
The weekly RSI supports the continuation of the decline for the altcoin. When evaluating market conditions, traders use the RSI as a momentum indicator to determine whether a market is overbought or oversold and to decide whether to accumulate or sell an asset. If the RSI is above 50 and the trend is up, the bulls still have an advantage. However, if the value is below 50, the reverse is true. The indicator is now below 50 (red icon) and falling. So both are signs of a downtrend. If the decline continues, the next closest support area will be $10. This would mean a 60% reduction from the current price. On the other hand, a return to the $40 resistance area is a 55% increase.
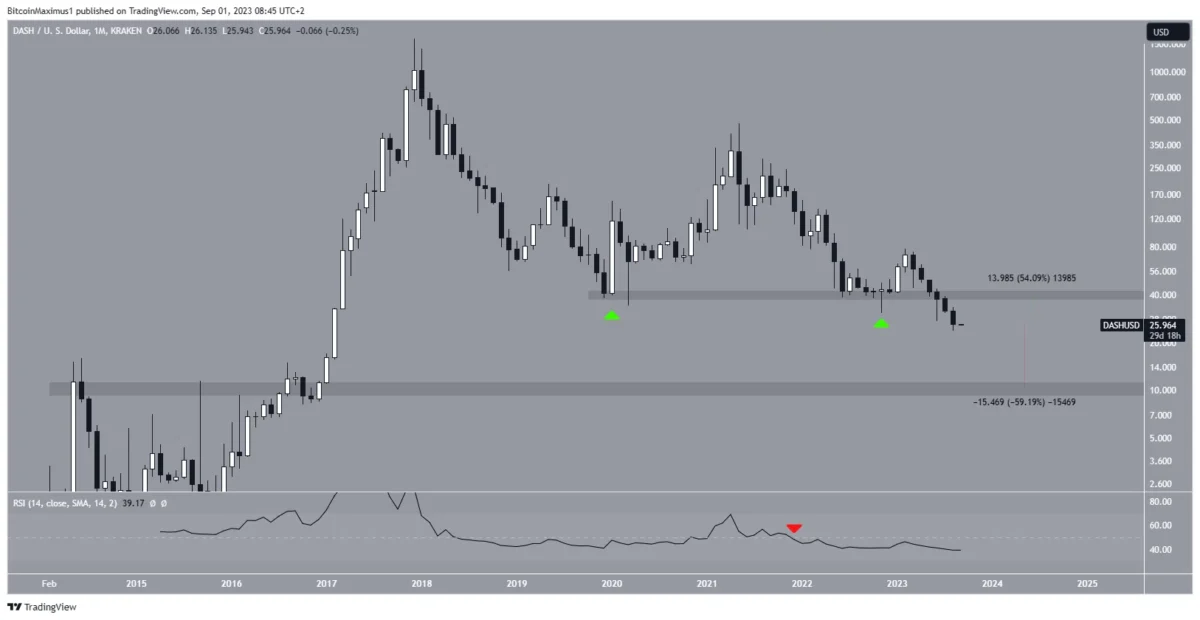 DASH Monthly Chart. Source: TradingView
ALGO drops to all-time low
The ALGO price has fallen since its November 2021 high of $2.99. The drop followed a steep descending resistance line quickly and without retracement. More recently, this line caused a rejection in April 2023. Later, ALGO broke out of the horizontal area of $0.11. Thus, it reached an all-time low of $0.08 on August 17. Subsequently, the altcoin failed to bounce and close above the $0.11 horizontal area. Moreover, it still follows the descending resistance line mentioned above.
Since the price is at an all-time low, the external Fib retracement can be used to identify the next level of support. Doing so opens a support level at $0.072. This would mean a 25% drop as measured from the current altcoin price. On the other hand, regaining the $0.11 area and breaking out of the long-term resistance line could lead to a 200% increase to the next resistance at $0.29. However, this is highly unlikely at the moment.
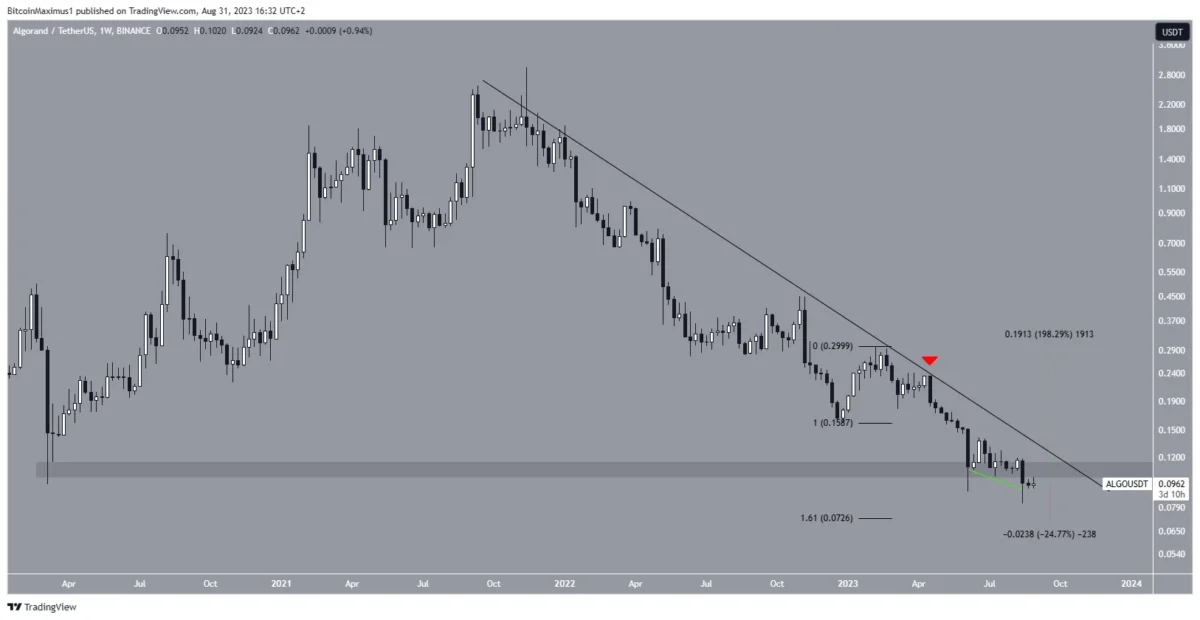 ALGO Weekly Chart. Source: TradingView
This altcoin price is approaching an all-time low
The EOS price has fallen since forming a lower high in June 2021. Over the past year, it has bounced several times in the horizontal support area of $0.90. However, the breakout in June invalidated the validity of the support area. The decline fell to an almost all-time low of $0.50 on August 17. EOS has slightly increased since the bounce was largely insignificant. The price is still 50% below the $0.90 horizontal area, which is currently expected to act as resistance.
Hence, the most likely EOS price prediction is bearish. If EOS breaks down from the $0.50 horizontal area, a further 80% drop is possible. Thus, it is likely to reach the next Fib support at $0.13.
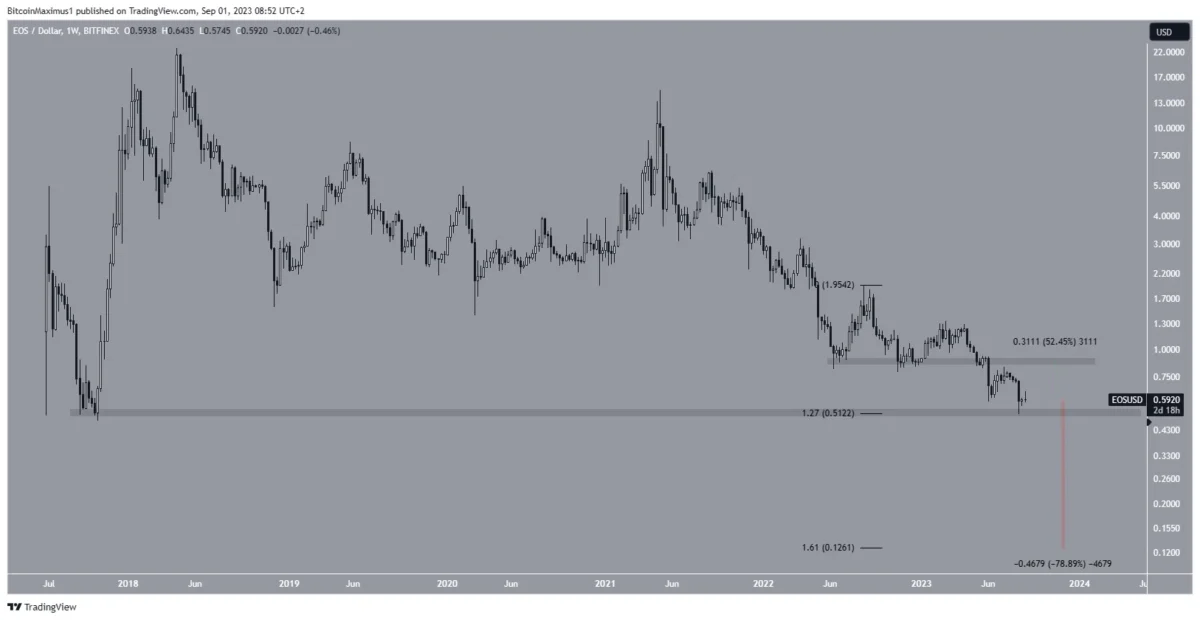 EOS Weekly Chart. Source: TradingView
Last month of September Tezos (XTZ)
XTZ price has been trading inside the $0.72 horizontal support area since late 2022. During this time, it bounced three times (green icons) inside the field. However, each bounce was weaker than the previous one. This indicates that the momentum is waning. It also shows that bears are slowly taking control. Therefore, a final break from the $0.72 zone could happen soon.
The presence of a descending resistance line further supports this bearish altcoin price prediction. If XTZ falls, it is possible to drop 30% to reach the next support at $0.50. This would be very close to the all-time low of $0.48. On the other hand, a break from the resistance line will mean that the trend is up. This is likely to lead the altcoin price to rise 80% to $1.25.
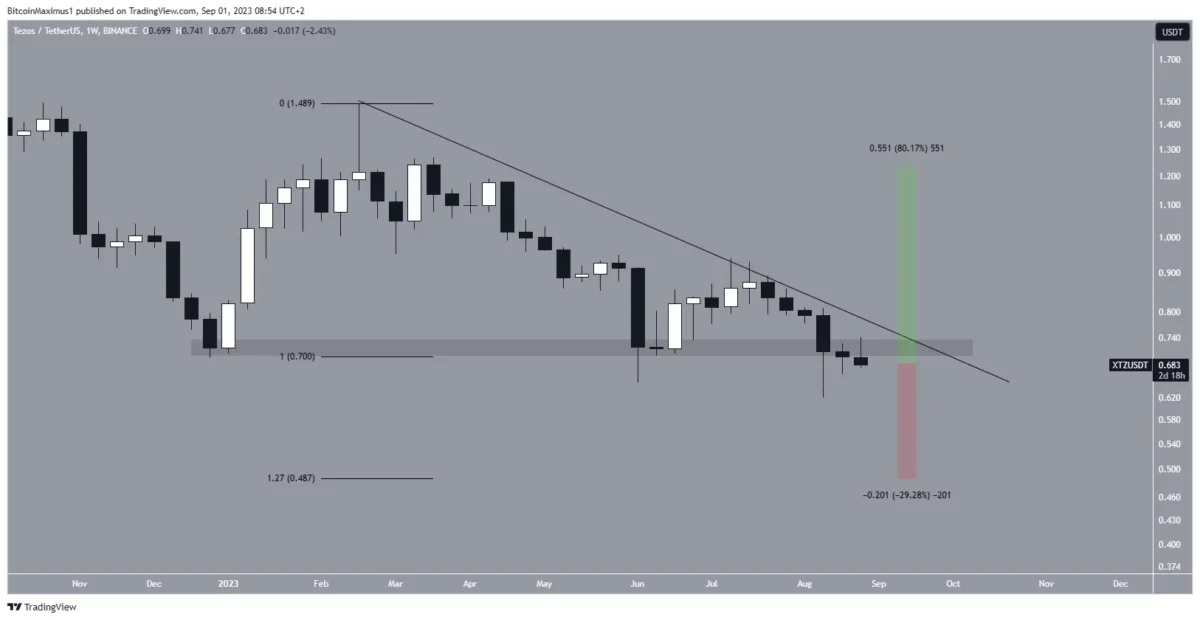
XTZ Weekly Chart. Source: TradingView
The estimates in the article belong to the analyst and are not investment advice. cryptocoin.comWe strongly recommend that you do your own research.