
Bitcoin remains stuck in a range, but some altcoins are showing signs of decline in the near term.
In the cryptocurrency market, bulls’ efforts to boost Bitcoin and increase inflows have failed. Bitcoin is stuck in a certain range. Although Bitcoin has remained dormant, bearish signs have emerged for altcoins.
What’s happening on the side of BTC, ETH, BNB, XRP, ADA, DOGE, SOL, TON, DOT and MATIC, in light of Bitcoin’s floating in the fixed price band and altcoins blinking?
What’s happening in the crypto market? BTC and altcoin analysis
Crypto bulls tried to push the Bitcoin (BTC) price higher on September 7. Although the intense appetite of the bulls was reflected in the market, the rise was short-lived. Short-term price movements revealed the indecisiveness of bulls and bears.
The price issue was also drawn to attention in a report prepared by ARK Invest. The report was based on factors such as interest rates, gross domestic product estimates, unemployment and inflation data. ARK Invest’s report also thinks that strong winds will accompany Bitcoin until the end of 2023. In other words, bearish scenarios may occur in the crypto market.
Bitcoin (BTC) price analysis
On September 7, Bitcoin (BTC) reached the 20-day exponential moving average (EMA) of $26,419. However, the bulls could not overcome this obstacle. This shows that the bears are fiercely protecting the 20-day EMA.
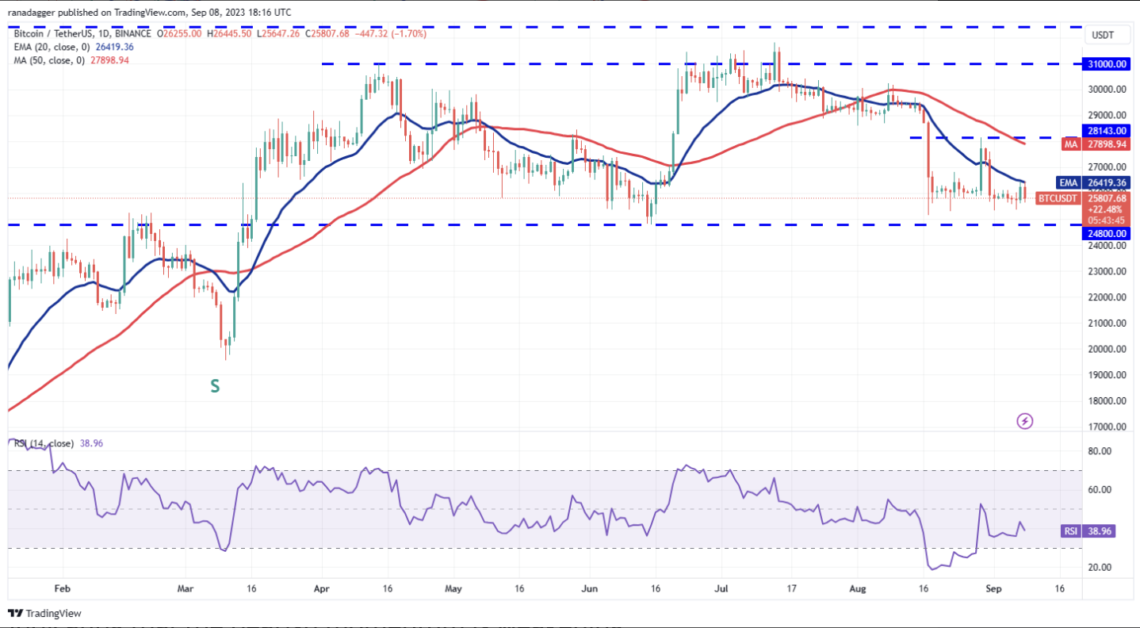
However, the failure of the bears to challenge the important support at $24,800 suggests that the selling is fading lower. The relative strength index (RSI) is trying to form a positive divergence, indicating that the bearish momentum is weakening.
The first sign of strength could be a breakout and close above the 20-day EMA. This could pave the way for a sustained recovery towards $28,143.
Conversely, if the $24,800 support breaks, BTC/USDT could start a downtrend. There is a minor support point at $24,000, but it may not stop the decline. The pair could eventually reach a key support at $20,000.
Ethereum (ETH) price analysis
Ethereum (ETH) continues to trade in a tight range between the 20-day EMA ($1,668) and the formidable support at $1,626.
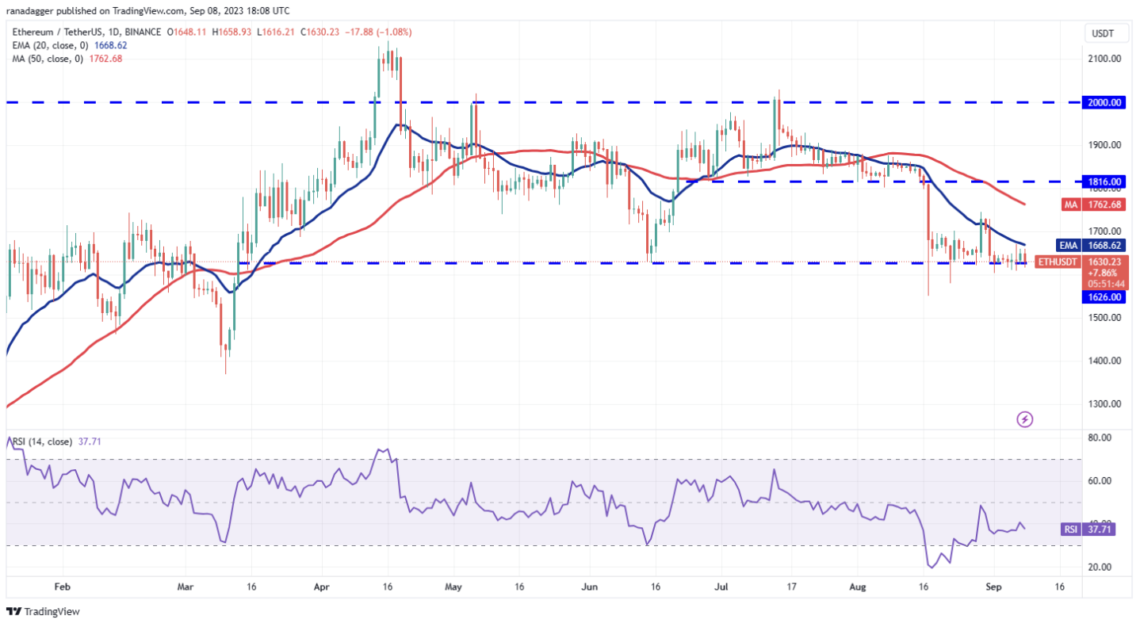
The failure of the bulls to overcome the overhead barrier at the 20-day EMA increases the risk of a breakout. Below $1,626, ETH/USDT could retest the August 17 intraday low of $1,550. Buyers could strongly buy the dip to this level as the pair could drop to $1,368 if the support is broken.
Time is running out for the bulls. If they want to avoid a collapse, they will first need to push the price above the 20-day EMA and then try to rise above the 50-day simple moving average (SMA) at $1,762. This may increase the possibility that the parity will remain between $ 2,000 and $ 1,626 for a few more days.
BNB price analysis
Bulls tried to push BNB. BNB broke above the $220 level on September 6, but the bears did not leave the price alone. This shows that the sellers are trying to turn the $220 level into resistance.
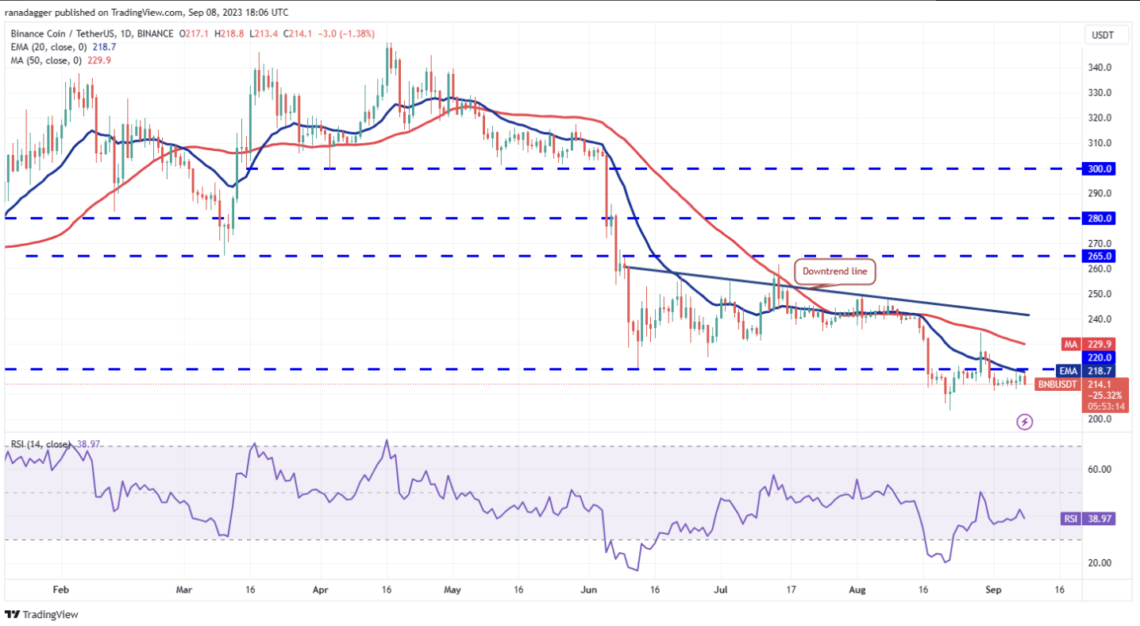
There is a minor support at $211, but if the bears push the price below it, the BNB/USDT pair could reach the psychological support level of $200. This level seems likely to attract buying from the bulls. If the price recovers from this support, it would indicate that the pair could consolidate between $200 and $220 for a while.
Contrary to this assumption, if the price turns up from the current level and rises above $220, it will indicate accumulation at lower levels. This could start a recovery towards the downtrend line.
Ripple (XRP) price analysis
Bulls took advantage of XRP’s fall below $0.50 on September 6. However, the failure to initiate a strong recovery on the price side indicates a lack of demand at higher levels.
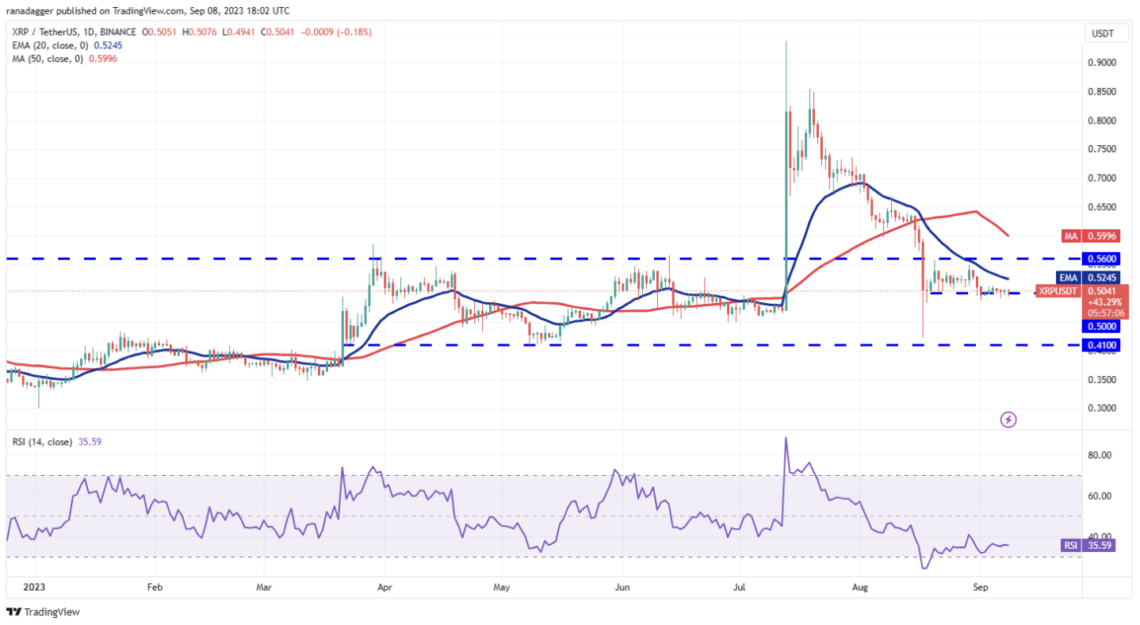
The bears will try to further strengthen their position by pushing the price below $0.50. If they can achieve this, the XRP/USDT pair could drop as low as the next major support at $0.41. This decline seems likely to be rapid as there is no major support between $0.50 and $0.41.
Conversely, if the price turns up from the current level once again, it will indicate that the bulls are trying to turn $0.50 into support. A break above the 20-day EMA will indicate that the pair will oscillate between $0.50 and $0.56 for a while.
Cardano (ADA) price analysis
Cardano formed a Doji candlestick pattern on September 6th and September 7th, indicating indecision between bulls and bears.
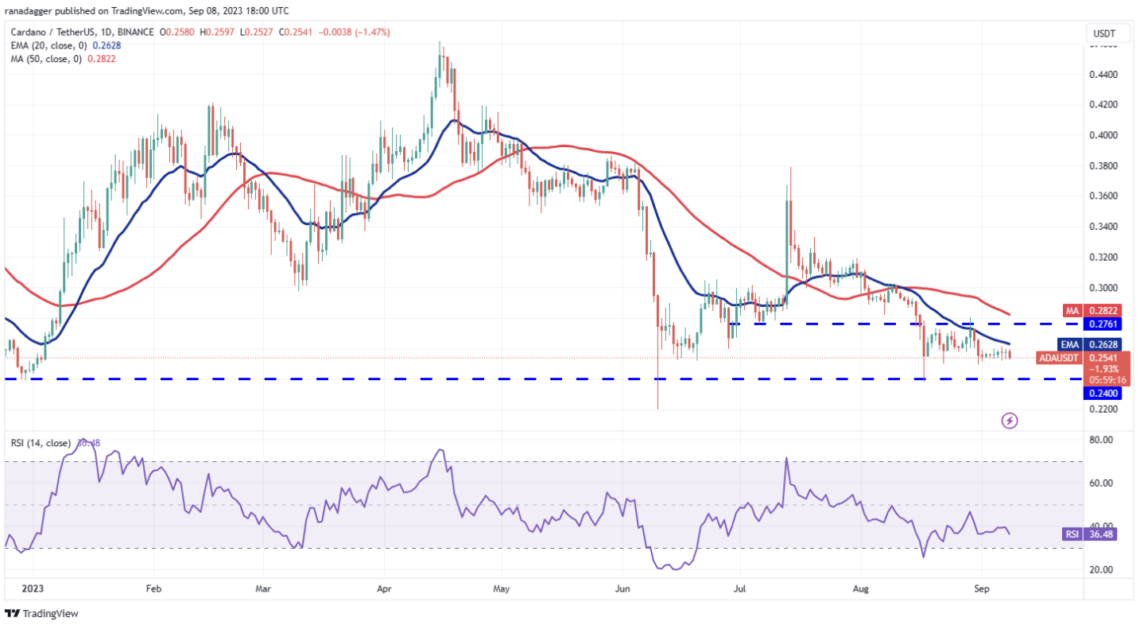
The downward-sloping 20-day EMA ($0.26) and the RSI in the negative zone increase the likelihood of a breakout to the downside. If the price falls below $0.25, the ADA/USDT pair could drop to the critical support at $0.24.
Blocking the upside move, the bears have repeatedly halted progress near the 20-day EMA. So, this becomes an important level to pay attention to. If the bulls force the price above the 20-day EMA, the pair could reach the overhead resistance at $0.28.
Dogecoin (DOGE) price analysis
The bulls attempted to push Dogecoin above the 20-day EMA ($0.06) on September 6, but the bears held their ground.
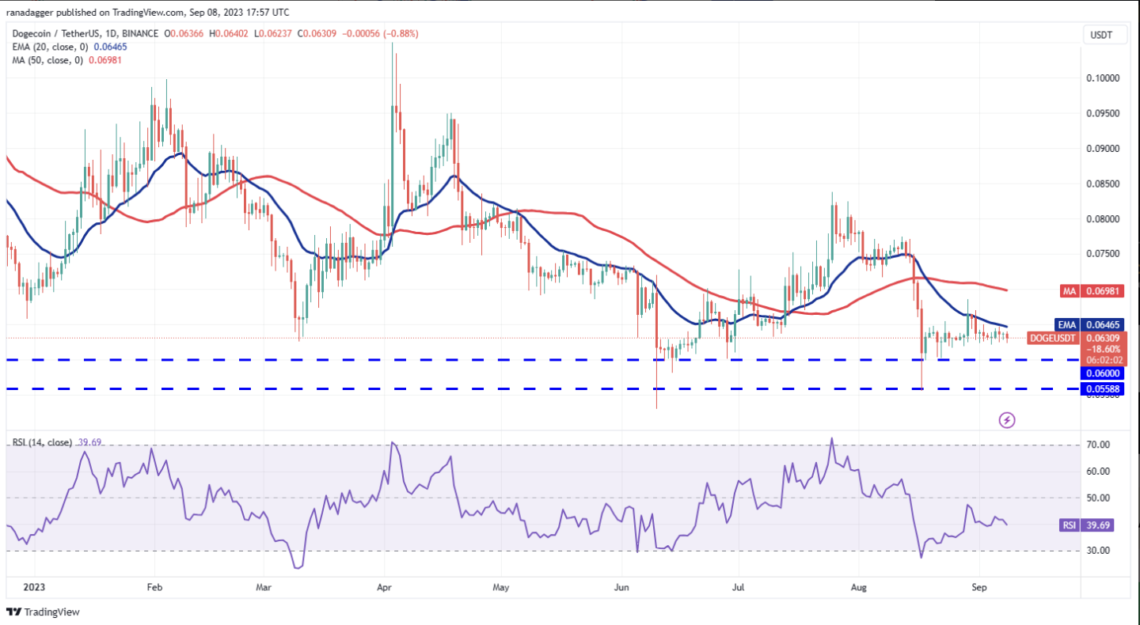
The price is stuck between the 20-day EMA and the horizontal support at $0.06. When the price is trading in a range, it is difficult to predict the direction of the breakout. However, the downward sloping 20-day EMA and RSI near 40 give signals to the bears. If the DOGE/USDT pair remains below $0.06, it could drop to $0.055.
This negative view will be invalidated in the near term if the bulls push and sustain the price above the 20-day EMA. Such a move would indicate the beginning of a stronger recovery to $0.07 and eventually $0.08.
Solana (SOL) price analysis
Solana is gradually correcting in the wide range between $14 and $27.12. The bears are turning relief rallies up to the 20-day EMA ($20.53) into opportunities, suggesting price sentiment is downside.
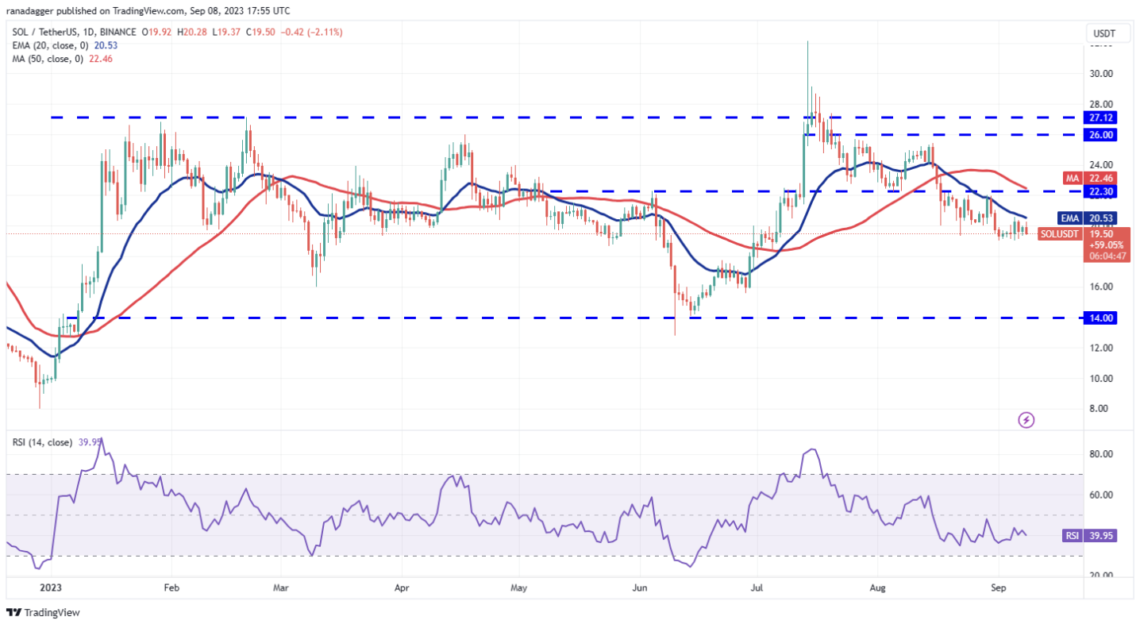
The repeated failure of the bulls to push the price above the 20-day EMA suggests that resistance is quite close. If the bears sink the price below the critical support at $19, the SOL/USDT pair could decline to $18 and then to $16.
It seems likely that the bulls have other plans regarding the price. SOL bulls will try to push the price above the 20-day EMA. If they succeed, the pair could reach the overhead resistance at $22.30. This is an important level for the bears’ defense. Because a possible breakout could pave the way for a potential rally to $26.
Toncoin (TON) price analysis
Toncoin (TON) attempted a recovery on September 6. However, the price candle on September 7 shows that the bears continue to sell on possible uptrends.
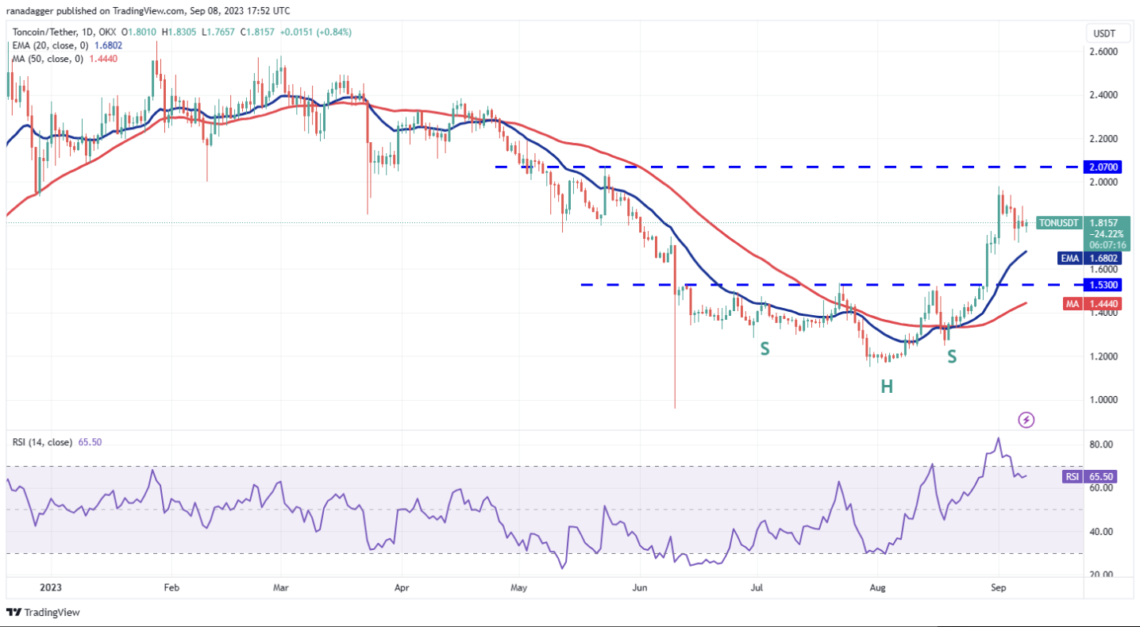
The 20-day EMA ($1.68) remains a key level to keep an eye on in the short term. If the price rebounds from the 20-day EMA, the bulls will attempt to push the TON/USDT pair back above the overhead resistance of $2.07.
On the other hand, if the price falls below the 20-day EMA, traders may be seen taking profits aggressively. The first stop on the downside is $1.53. Another downside move is at the 50-day SMA ($1.44).
Polkadot (POL) price analysis
The bears pulled Polkadot below strong support at $4.22 on September 6. However, as seen from the long tail on the candlestick, the bears were unable to sustain lower levels. This reveals that purchases are made as the price drops.
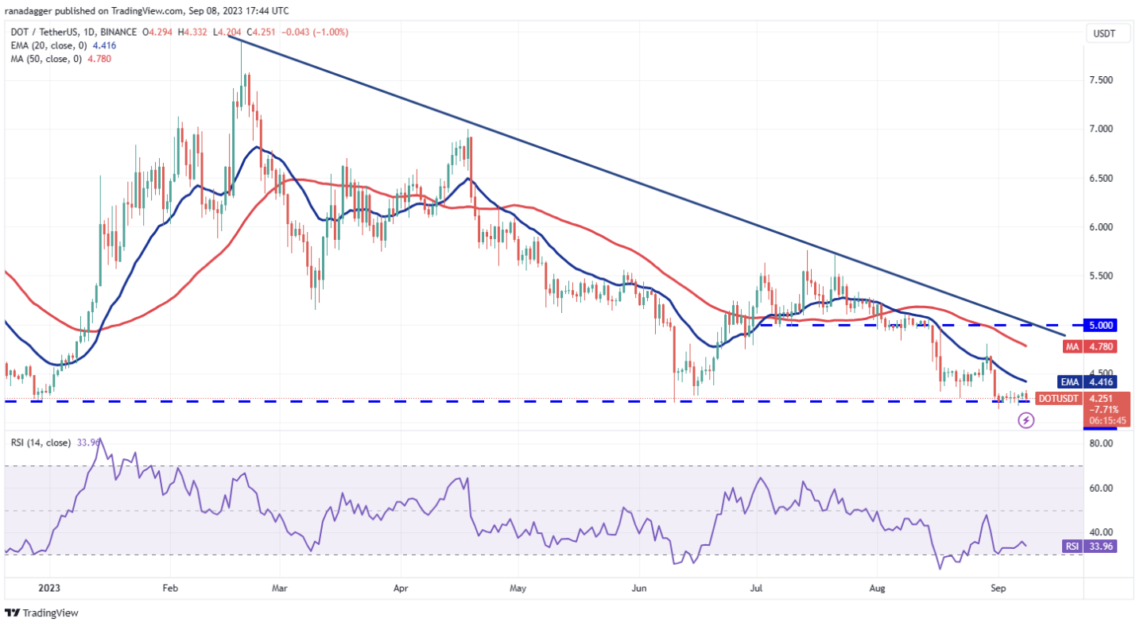
Although the price rose, the bulls were unable to maintain the momentum and push the price to the 20-day EMA ($4.41). This shows that every small increase comes with selling pressure. The bears pulled the price back to the key support at $4.22. If this support breaks, the DOT/USDT pair could fall to the psychological support at $4.
If the bulls want to make a comeback, they will have to push the price above the 20-day EMA. If they do so, the pair looks likely to climb to the downtrend line. This is one of the key levels to consider. Because a break above this price could signal the end of the downtrend.
Polygon (MATIC) price analysis
Buyers have attempted to push Polygon above the 20-day EMA ($0.56) over the past three days. However, the MATIC bears held their ground. This situation shows that selling pressure has broken out in small increases.
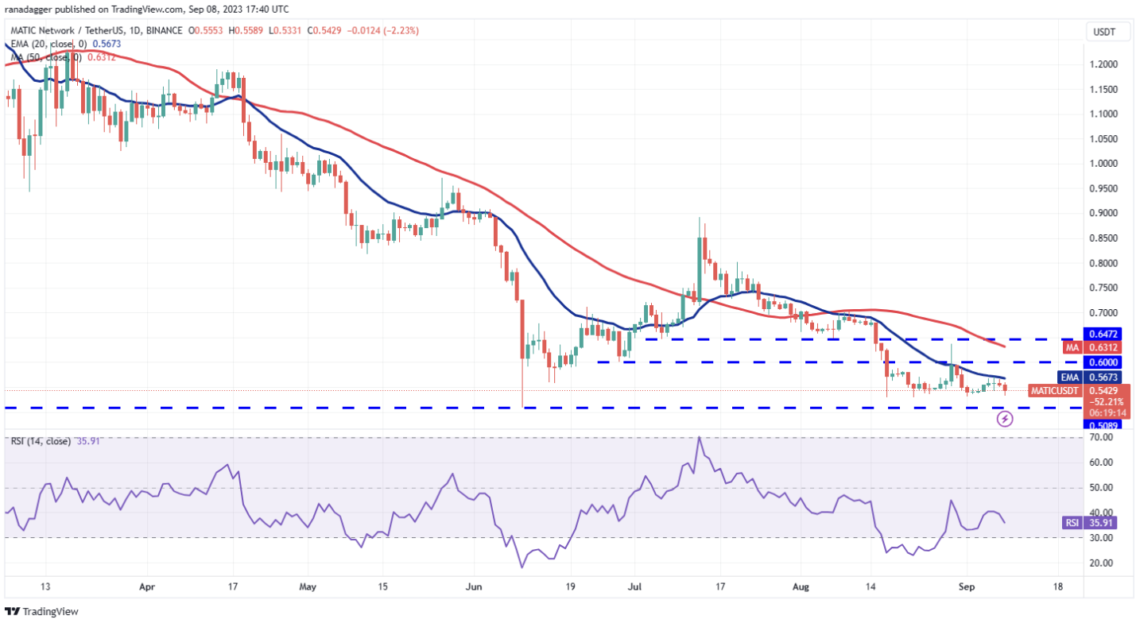
The bears will try to sink the price below the critical support at $0.53. If they do, the MATIC/USDT pair could drop to the key support at $0.50. The bulls are expected to protect this level strongly. Because a break below this could break the ropes for more declines to $0.45.
The bulls will need to push the price above the 20-day EMA and sustain it to show that bearish pressure is easing. This could initiate a recovery towards the $0.64 resistance, where the bears can make a strong defense again.