
STORJ price increased by 90 percent in September. However, the altcoin then entered a period of stagnation. Stellar, on the other hand, is trading near the convergence point between the descending resistance trend line and the long-term horizontal support area. Crypto analyst Valdrin Tahiri predicts a bearish route for both altcoins.
STORJ price prediction: Preparing for a pullback for the altcoin!
cryptokoin.com As you follow from , STORJ had a strong rally in September. However, later this rally stopped. Now there are strong signs of decline. Technical analysts use Elliott Wave theory to identify recurring long-term price patterns and investor psychology that help them determine the direction of a trend. According to EW theory, STORJ has completed a five-wave rise that started on August 15 (green icon). Two features define this altcoin price count. First, the fifth wave ended at the 1.61 outer Fib retracement level of the fourth wave. This is a common level for a local peak.
According to the theory of Fibonacci retracement levels, after a significant price change in one direction, the price is expected to partially return to a previous price level before continuing in the same direction. It is also possible to use this theory to determine the peak of future upward movements. Secondly, there is a significant bearish divergence in the RSI between the third and fifth waves. This is also a sign of downward trends. A bearish divergence occurs when a price increase is accompanied by a decrease in momentum. If the STORJ count is correct, the altcoin will gradually decline towards the horizontal support area at $0.32. This means a 25% drop from the current price.
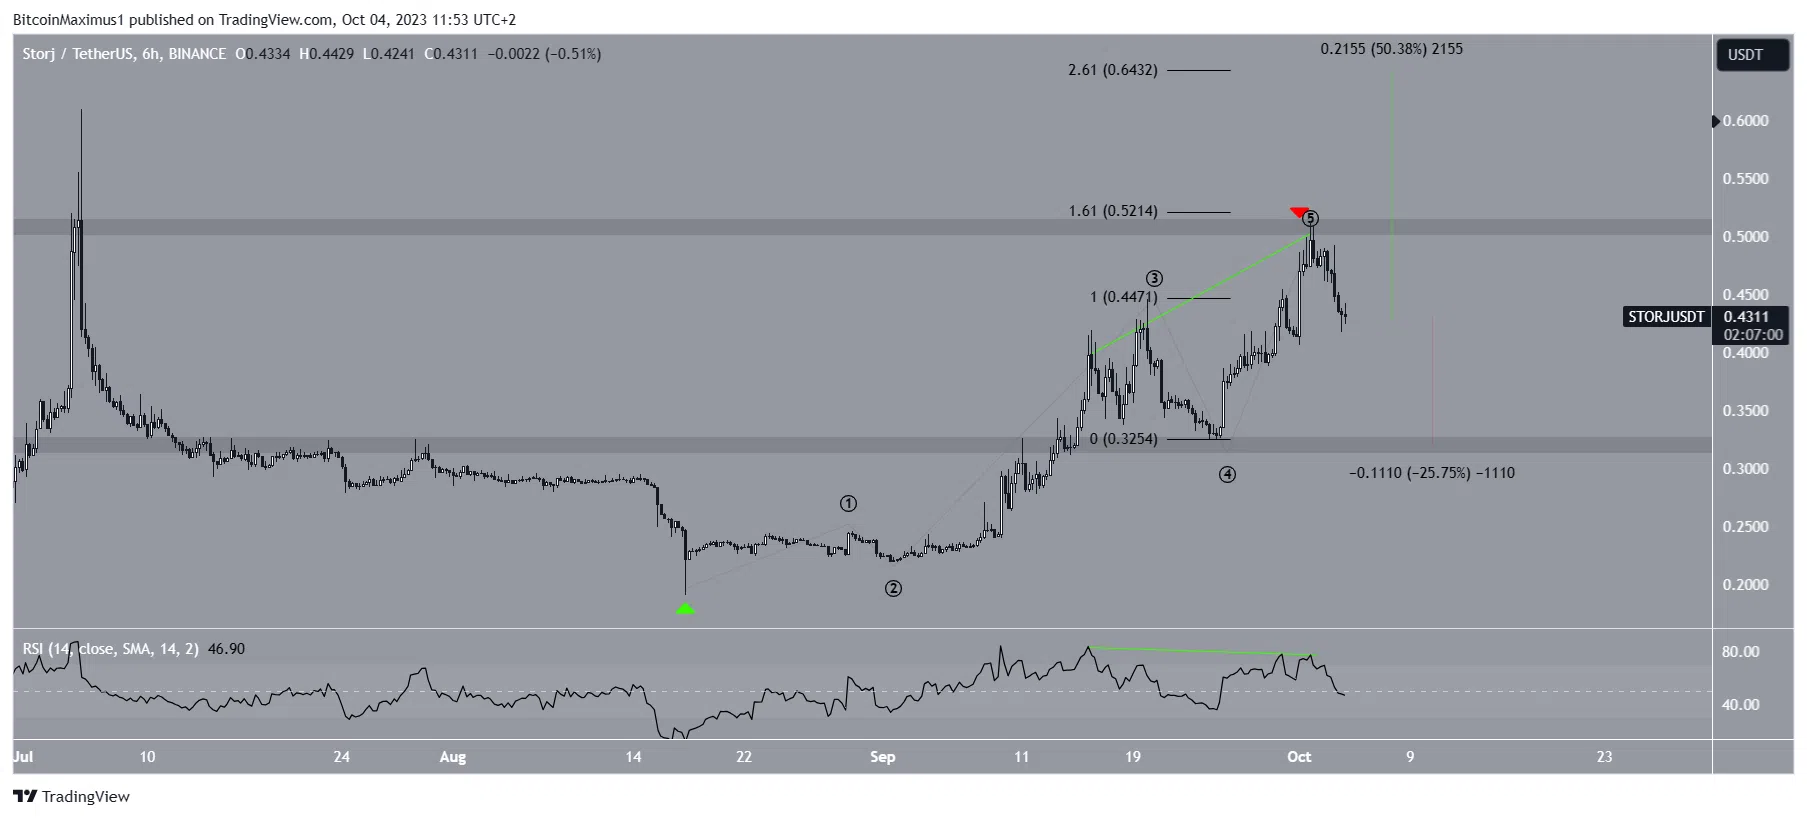 STORJ 6-Hour Chart. Source: TradingView
Despite this bearish short-term STORJ price forecast, a move above $0.51 would mean the local top is not yet inside. In this case, it is possible for the altcoin to move to the next resistance at $0.64, an increase of 50% from the current price.
XLM price prediction: Will the bear pattern lead to a breakout?
A descending triangle is considered a bearish formation. Therefore, an eventual breakout from this formation is the most likely future price scenario. Besides the triangle, analysts consider the August 17 increase to occur within an ascending parallel channel (white) to be bearish. Channels often contain corrective actions. Therefore, an increase within a channel means that the trend is downward.
If the altcoin closes below $0.110, a breakout from the bearish XLM pattern will be confirmed. A decline traversing the entire height of the triangle (black) would pull the price just below the horizontal support area at $0.076. This would mean a 35% drop from the current price.
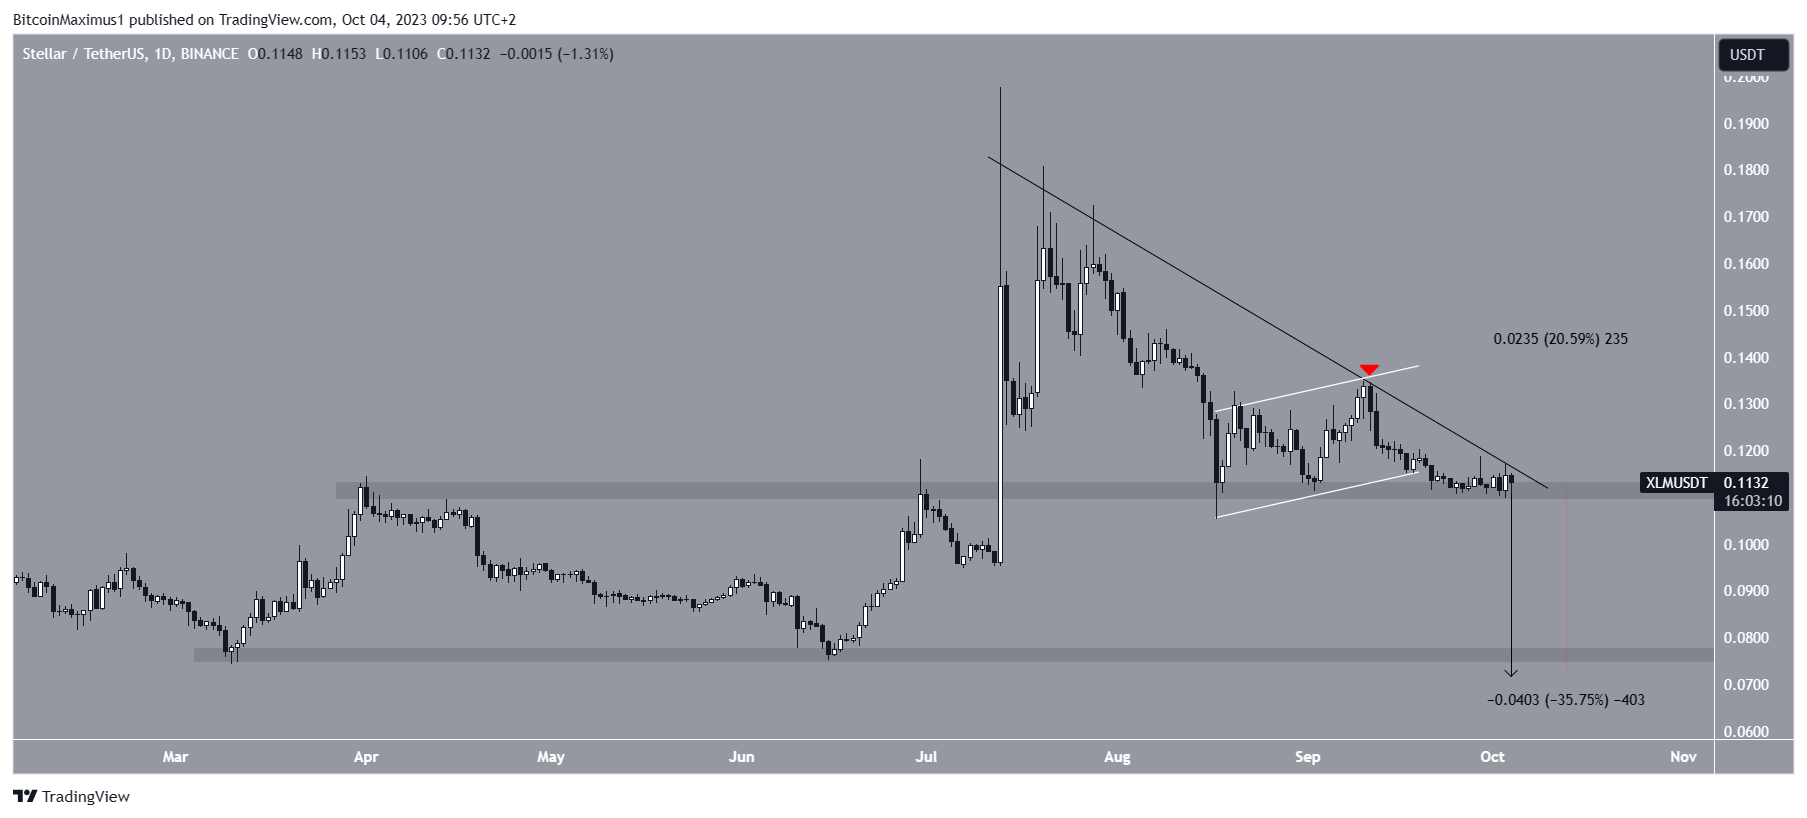 XLM Daily Chart. Source TradingView
Despite this bearish altcoin price prediction, a break from the descending resistance trend line would mean that the trend is still up. In this case, a 20% rise to the $0.140 resistance would likely be the future price outlook.
The opinions and predictions in the article belong to the analyst and are definitely not investment advice. We strongly recommend that you do your own research before investing.
To be informed about the latest developments, follow us twitter ‘ in, Facebook in and Instagram Follow on and Telegram And YouTube Join our channel!