
Amid the cryptocurrency market trying to recover after a dramatic crash, crypto analyst Anushsamal analyzes Cardano (ADA) and Ripple (XRP) prices and tries to find direction for altcoins’ next moves. We also prepared Anushsamal’s analysis and predictions for our readers.
Key trading levels for Cardano
Cardano consolidated after trying to rise on the one-day chart. As you’ve seen in Cryptokoin.com news, Bitcoin has increased the losses and therefore the broader market continues to show signs of weakness. The one-day chart is showing mixed signals that could mean the altcoin may try to head north.
Over the past 24 hours, ADA has gained significantly, gaining just over 1% over the past week, mainly as it consolidated. In addition, buyers in the market tried to show strength due to the bull trend of the crypto currency last week.
If buyers remain in the market, ADA could push the immediate resistance at $0.60 and trade. If sellers regain strength, the price of ADA could fluctuate, causing bears to take over.
Cardano price analysis
ADA was trading at $0.57 at the time of writing. After rising almost 22% over the past week, the altcoin has recorded a casual price action. The close support line was at $0.47. A drop below it could push ADA below $0.40.
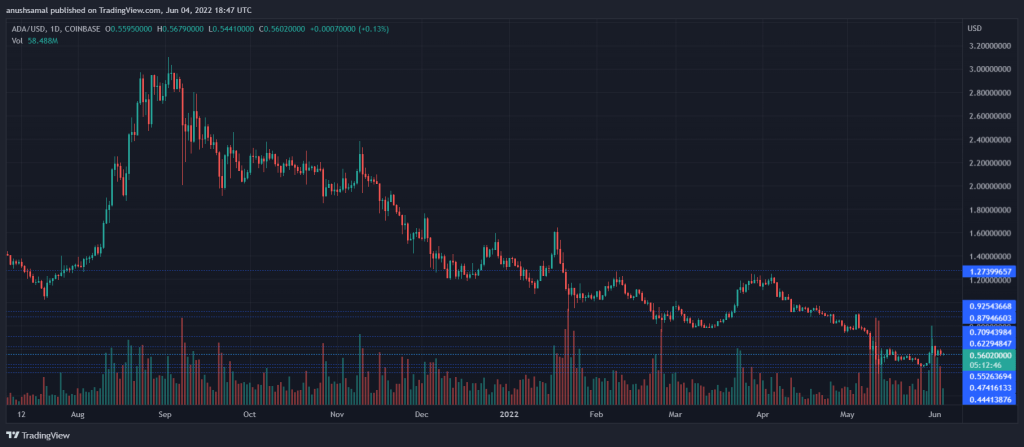 Cardano, one-day chart| Source: TradingView
 The overall price cap for ADA remains at $0.62 and Cardano must at least trade above the $0.70 price mark for the bulls to strengthen again. As the altcoin is trading sideways, an upside move can be expected. The volume of the traded coin is recorded in green, which indicates bullishness.
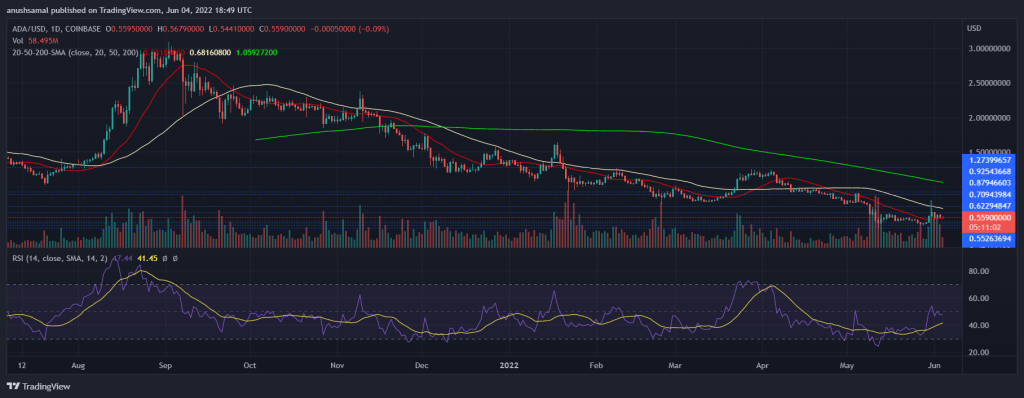
Cardano’s purchasing power recovers | Source: TradingView
The recent bloodbath in the crypto market has pushed Cardano into the oversold territory. The altcoin was last oversold in December 2021 before that. In the Relative Strength Index, the altcoin tried to break above the half line.
This meant ascension. However, at press time, the Relative Strength Index dropped slightly. Despite the small drop, the altcoin is still dominated by buyers. According to the same data, the ADA price was above the 20-SMA. Data above the 20-SMA means that the buyers are increasing the price momentum in the market.
 Cardano signals buy on one-day chart | Source: TradingView
 The Moving Average Convergence Divergence turned positive as buyers returned to the market. The MACD burned green signal bars as the bulls re-emerged in the market. These green bars can also be interpreted as buy signals.
The frequency of buying signals in the market is also consistent with the Relative Strength Index. Chaikin Money Flow (CMF), an indicator that measures capital inflows and outflows, has given signs of recovery. Despite an increase in capital inflows, the CMF showed a decline at the time of writing, which can be attributed to declining capital inflows. If buyers continue to maintain the momentum, the price of ADA is still on the optimistic lines.
XRP consolidates, will it return now?
Among other leading altcoins, XRP is consolidating on its chart. Bitcoin slumped below the $30,000 price level, which dampened the altcoins’ price action. In the last 24 hours, XRP has made no price movements. In the last 24 hours, the altcoin has gained as little as 1.71%.

On the chart, the altcoin showed bearish price action as the coin may be breaking consolidation. XRP currently finds support at $0.34. XRP last touched the price level in February 2021. If the coin pushes further down, then it could touch the $0.28 support level.
The global cryptocurrency market cap today was $1.28 Trillion, with a positive change of 0.7% in the last 24 hours. If the bulls are still struggling to break the $0.43 resistance level, XRP could head towards another decline.
XRP price analysis
Altcoin was trading at $0.3972 at the time of writing. The local support level for the coin remains at $0.33. If XRP continues to experience selling pressure, it could drop as low as $0.28. The overall resistance for the coin is located at $0.40.
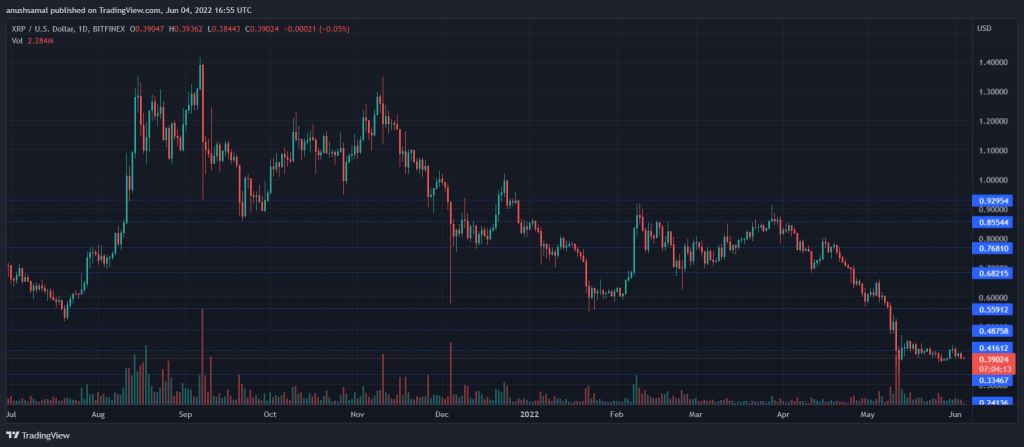 XRP, one-day chart| Source: TradingView
 For the bulls to bounce back, XRP must surpass the price resistance mentioned above and trade around $0.43. The volume of XRP traded has dropped as seen on the one-day chart. The volume bar has been spotted in red, which shows a bearish trend in the market.
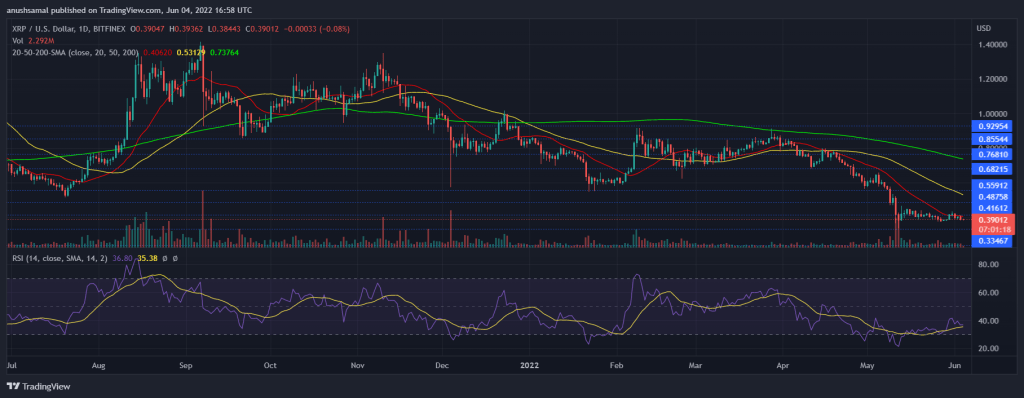 XRP shows signs of recovery on RSI | Source: TradingView
 Purchasing power tried to rise on the chart. After the altcoin was oversold, it rebounded slightly, as seen in the Relative Strength Index. At the time of writing, the RSI was above the oversold zone, although the same selling pressure was strong in the market.
XRP price was struggling to cross the 20-SMA line. At press time, the altcoin was still below the 20-SMA, suggesting that bears were driving the price momentum in the market. Should demand for XRP emerge, the coin could climb above the 20-SMA line, which could push XRP to trade near the $0.40 price mark.
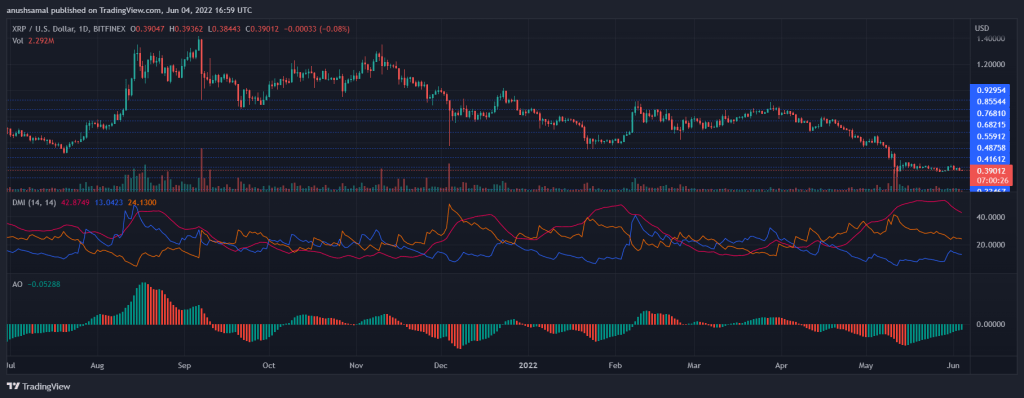 XRP registers buy signal | Source: TradingView
 XRP could bottom soon and then target the next resistance level. The coin showed a buy signal on the chart. Awesome Oscillator (AO) shows price momentum and changes in price momentum. Green signal bars at
AO are synonymous with a buy signal, which could also mean a change in price action. Directional Movement Index was positive corresponding to AO. +DI was above the -DI line, indicating bullish formation. The Average Directional Index was also above the 40 mark, a sign that the price trend in the market is getting stronger.


