Crypto analyst Arman Shirinyan says that based on the charts, volatility in Shiba Inu (SHIB) price will start to increase. Also, the bullish price action of Solana (SOL) and Avalanche (AVAX) pushes both altcoins to key resistance areas, signaling that they will continue to rise in the coming weeks.
“SHIB moves in descending triangle”
As you can see from cryptokoin.com news, in recent weeks and even months, Shiba Inu (SHIB) For investors, the asset did not fare as well as they had previously expected when they approached ATH values. According to analyst Arman Shirinyan, such a trend was likely caused by an extremely high number of individual investors, but there is still hope, according to technical analysis.
The analyst states that as the daily chart shows, SHIB is currently moving in a descending triangle pattern, which is causing traders to face upcoming volatility spikes in both directions. During the February-March period, SHIB was moving in a similar chart pattern. Unfortunately, SHIB broke the lower border of the pattern, resulting in a 51% drop.
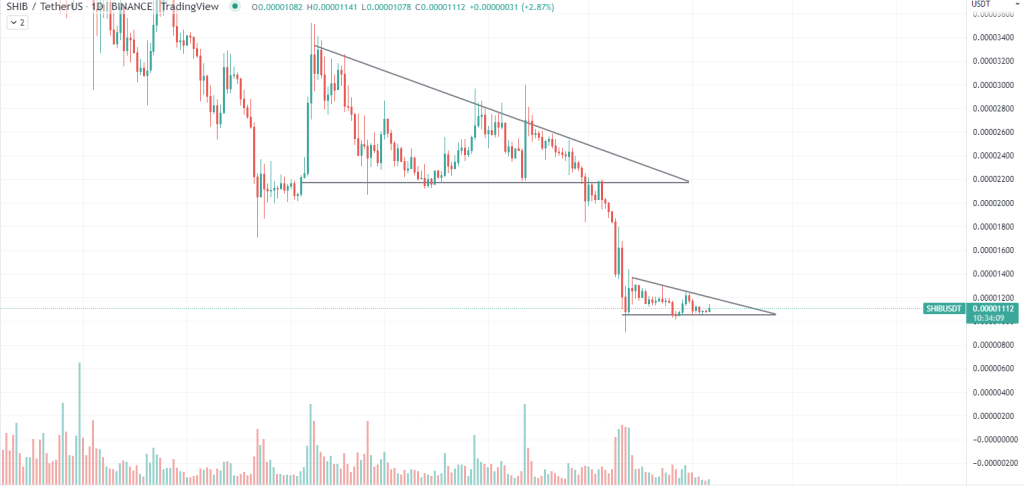 SHIB 12-hour chart / Source: TradingView
 In a similar situation, the Shiba Inu has fallen well below $0.00001, which is the ‘dedicated’ support for the asset in the last two weeks. We see.
However, the analyst says that if the meme coin manages to break out of the upper boundary of the pattern, a reversal is still possible, which should lead to an increase in upside volatility. The analyst also predicts that the breakout of the pattern will most likely occur in the next 10-12 days.
“Solana and Avalanche on the brink of a possible explosion”
Solana (SOL) and Avalanche (AVAX) started the week on a positive note, according to analysts. , but they have not yet overcome significant resistance. Analysts note that upside volatility is returning to the cryptocurrency market and SOL and AVAX seem to be taking advantage of it. Analysts picture the technical outlook for SOL and AVAX as follows.
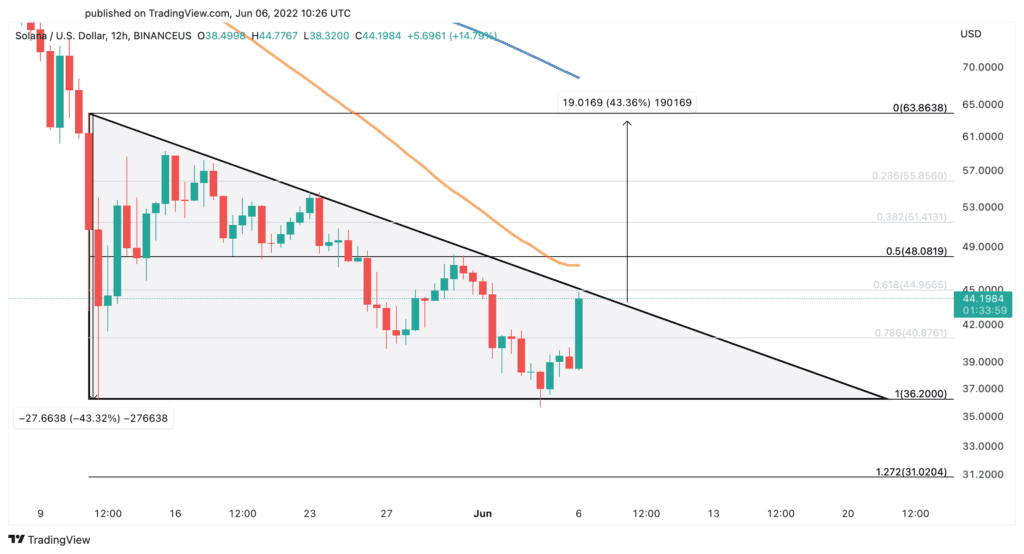
SOL increased its price by more than 15% from $38.50 to $44.80 on Monday. More upward pressure can help Solana push through resistance and get higher.
Technically, Solana appears to have formed a descending triangle on its 12-hour chart. The recent rise brings the SOL closer to the hypotenuse of the pattern, implying a potential breakout. Still, the SOL needs to surpass the 50 hourly moving average around $47 to confirm this optimistic outlook. If Solana manages to close a 12-hour candlestick chart above the $47 resistance, it could rise more than 40% towards a target of $62.
 LEFT 12h chart / Source: TradingView
 Technical indicators for Avalanche also show the potential for short-term progress. The Tier 1 token is up about 15% since Monday’s opening and has overcome a previous resistance area. However, AVAX has yet to break through the subsequent supply hurdle and is unable to make any further gains.
The bullish price action over the past few hours has allowed a developing falling wedge to cross its upper bound on Avalanche’s 12-hour chart. This technical model now predicts that AVAX could move further 40% towards $37. Whether Avalanche can break the 50 hourly moving average at $28 will confirm or invalidate this optimistic view.
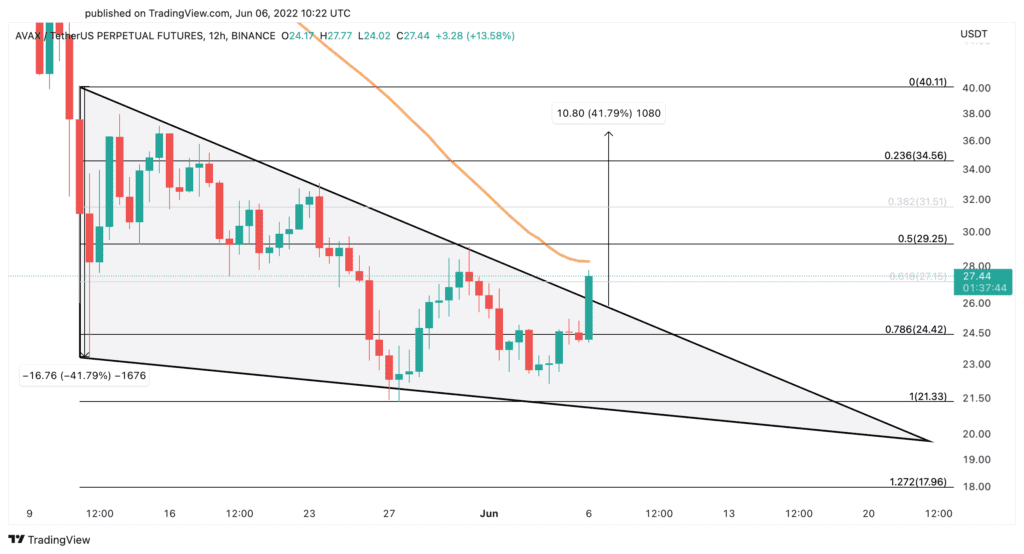 AVAX 12-hour chart / Source: TradingView
 Although the odds seem to be in favor of the bulls, caution is advised with current price levels. Failure to overcome resistance may create uncertainty among market participants, leading to an increase in bids.
If this bearish scenario materialises, Solana could potentially drop below $36 and pull back to $30 to invalidate the bullish thesis. A similar move could affect Avalanche if it breaks the $21 support level, with AVAX showing that more declines to $18 are possible.