The gold price is trading sideways near $1,850 at the beginning of the week after the sharp decline seen on Friday. According to market analyst Eren Sengezer, gold is likely to continue to fluctuate between key technical levels. Market analyst Dhwani Mehta sets the levels to watch for the yellow metal. Following Bitcoin’s exit from $31,300, IntoTheBlock also shared the price levels that traders and investors should pay attention to.
Rising US interest rates limit the rise of gold price
Kriptokoin.com Non-Farm Employment in the US increased by 390,000 in May. exceeded the market’s expectation for an increase of 325,000. Further details of the report showed the Labor Force Participation Rate rose modestly to 62.3% and annual wage inflation fell to 5.2% as expected.
US Treasury yields rose on the upbeat US jobs report, forcing gold to erase its weekly gains. The benchmark 10-year rate rose more than 7% last week, ending a three-week streak. At press time, the 10-year rate was moving up and down in a narrow channel close to 2.95%.

“Gold may react to ECB and US inflation data”
Later in the week, the European Central Bank (ECB) policy rates are expected to remain unchanged. With the Asset Purchase Program (APP), which will expire in July, the Bank is preparing to increase the policy rate by 25 basis points in July. According to Bloomberg, some policymakers want ECB President Christine Lagarde to deliver a convincing message that the borrowing costs of vulnerable countries will be contained and fragmentation not allowed. According to Eren Sengezer, a strong reaction to the ECB’s policy announcements in XAUEUR could affect the movements of XAUUSD in the second half of the week.
The most important data of the week will be the May inflation report from the USA on Friday. Consumer Price Index (CPI) and Core CPI are expected to decrease to 8.2% and 5.9%, respectively, on an annual basis. Analyst sees stronger-than-expected CPI figures likely to trigger a new rise in US interest rates and make it harder for gold to find demand, as NFP data confirms that US labor market conditions remain tight.
On the other hand, the analyst states that a pullback in consumer inflation could help investors start pricing with a pause in Fed rate hikes in September and gold to rise. The analyst makes the following assessment in general terms:
Prior to the important events mentioned above, gold may find it difficult to make a decisive move in either direction. The market mood seems to have turned better at the beginning of the week. If risk flows continue to dominate the markets, the dollar could lose altitude and help gold hold its ground. But in this scenario, US interest rates may gain traction and not allow gold to turn north.

Gold price technical view
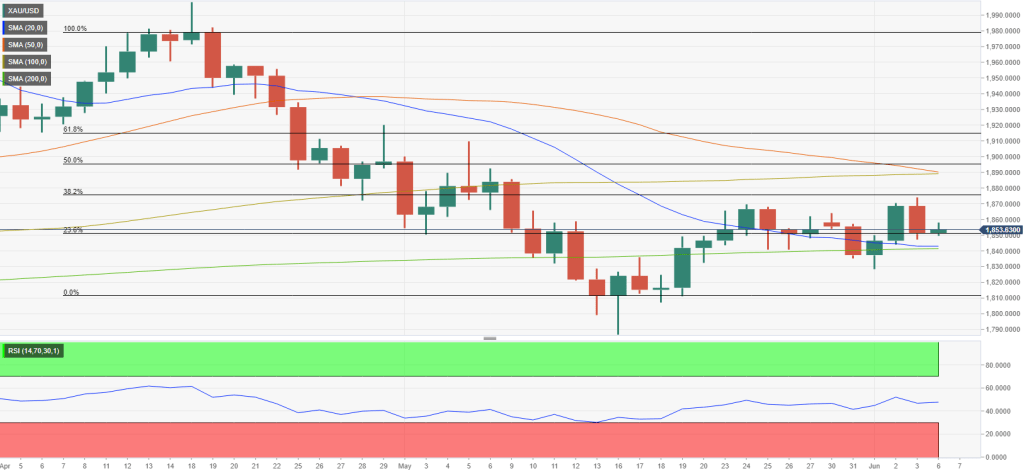
According to Eren Sengezer, gold price shows the horizontal decline of the Relative Strength Index (RSI) indicator on the daily chart. It appears to have entered a consolidation phase on Monday, with the increase to 50. The analyst states that if this level turns into resistance, gold could drop to $1,840 where the 200-day SMA is located. According to the analyst, a daily close below this level could be seen as a significant bearish development and open the door for additional losses. He points out the following levels:
On the upside, $1,875 is aligned as initial resistance ahead of $1,890 / $1,900 area and $1,915. It wouldn’t be surprising to see gold continue to fluctuate in the $1,875-1,840 range until a fundamental catalyst triggers a strong market reaction.
“Yellow metal feels cautious around $1,850”
Market analyst Dhwani Mehta, 50-Day Moving Average, which bears a bearish trend. He notes that the DMA is set to surpass the horizontal 100-DMA on the downside, and if that happens, it will confirm a bearish crossover, reviving selling interest in the yellow metal. Dhwani Mehta continues his technical analysis in the following direction.
With strong support at $1,842, the combination of bearish 21-DMA and sideways 200-DMA will be risked. Acceptance below the latter on a daily close basis will require a test of the previous week’s low of $1,829.
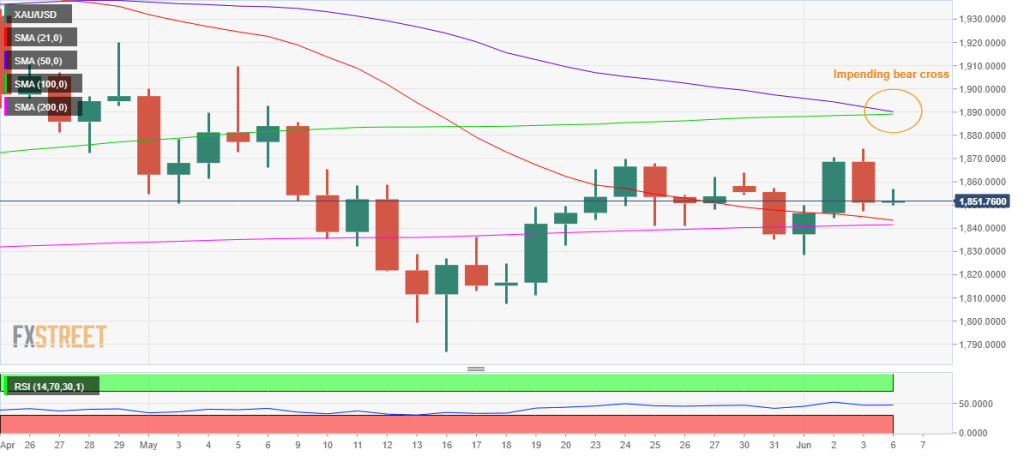
If buyers manage to extend control, then a retest of the $1,860 level is expected. The next major bullish target is aligned with highs near $1,870 at the end of May.
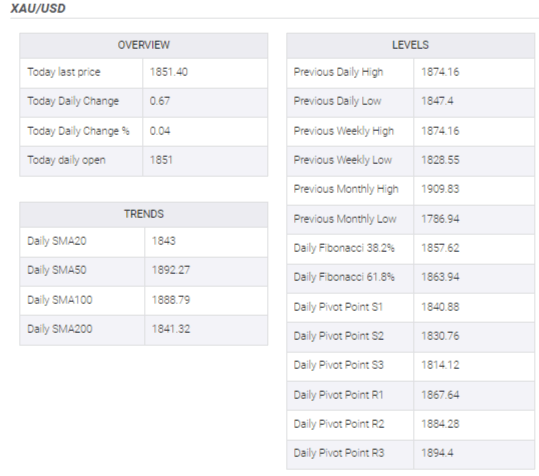 Gold price: Additional important levels to watch
 3 important Bitcoin levels to watch
Following Bitcoin’s exit from $31,300, IntoTheBlock, He shared the price levels on the chart that traders and investors should pay attention to, as they can bring additional volatility and unexpected price movements.
To determine local support and resistance levels, IntoTheBlock uses a metric that shows the volume of entries around a certain price. Currently, we see that a significant price level has formed around $30,000 with a total volume of 980,000 BTC.
1/ As $BTC breaks the 8 weekly red close, it soars by 5% up t $31,400.
Which are the key price levels on the path ahead for #Bitcoin?
Using out IOMAP indicator, we identify key buying and selling areas that are expected to act as support and resistance.
— IntoTheBlock (@intotheblock) June 6, 2022
Such a large volume, traders’ Bitcoin is actively reflects the fact that he bought at the same price and is likely betting on a reversal at $29,000.
crypto analyst Arman Shirinyan, who commented on the IntoTheBlock data, says that to go further, Bitcoin will have to absorb more than 220,000 BTC in volume in the coming hours, or another reversal below $30,000. The analyst states that at the moment, only 30% of traders lost money from Bitcoin trading at $31,420, indicating that there should be no selling pressure even from those breaking through the current price.

As for technical support and resistance levels, the analyst notes that BTC is currently sitting at support and has been moving in the consolidation channel that has formed since mid-May. Finally, the analyst says that the first resistance on the daily chart is at $40,000.
At press time, Bitcoin is trading at $31,400 and is trying to break past the last reversal point of $31,800 on the chart. According to the analyst, unfortunately, purchasing volume remains the main issue holding back digital gold from starting a new rally to $40,000.