Potential Bearish Trend for Bitcoin (BTC)

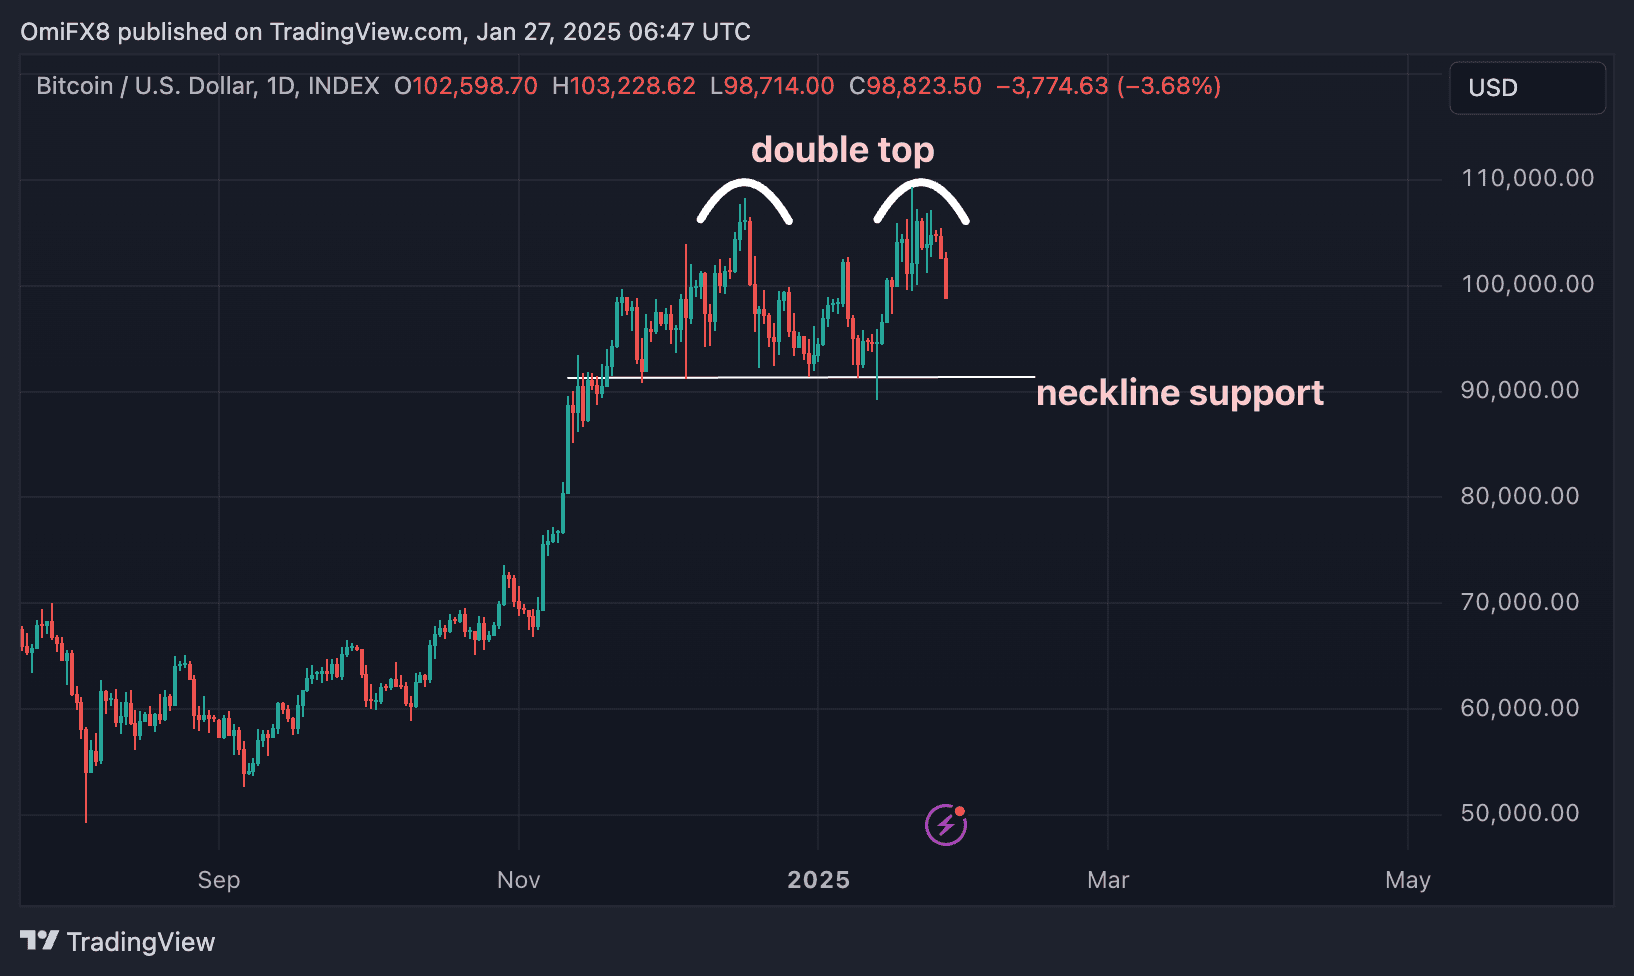
Bitcoin (BTC) is currently at a crossroads, as it may face a significant decline to $75,000 if it confirms a ‘double top’ bearish reversal pattern. This technical formation occurs when two consecutive peaks are observed at roughly the same price level. Traders typically draw a trendline through the lowest point between these peaks, which serves as a crucial indicator of market sentiment.
Essentially, the failure of BTC to break above the previous peak, coupled with a subsequent downturn, signals that the prevailing uptrend is losing momentum. The key to confirming this bearish trend lies in the breakdown of the horizontal trendline support, known as the double top neckline. Should this support be breached, it would signify a notable shift from a bullish to a bearish market outlook.
At the time of writing, BTC has retreated to approximately $100,000, having struggled to maintain its position above the December high recorded last week. This suggests that BTC may indeed be forming a double top, with the neckline support situated around $91,300. If Bitcoin closes below this neckline level on a UTC basis, it would validate the bearish reversal pattern, potentially leading to a decline towards the projected target of $75,000.
The target price of $75,000 is derived through the measured move method, which involves subtracting the gap between the twin peaks and the neckline from the neckline level. As traders keep a close watch on these technical indicators, the outcome of this potential double top could have significant implications for the future trajectory of Bitcoin.
BTC’s double top analysis illustrated. (TradingView/CoinDesk)


