Solana (Left) moves horizontally at the level of $ 237, approaching an important decision of the market. Although the current price movements show that investors are undecided about direction, technical indicators indicate that there may be a big break soon.
Solana collects power at $ 237
Solana is currently trading at $ 237,80 and has experienced a slight decrease of 0.22 %in the last 24 hours. However, despite this decline, the general market structure is still positive. One of the most important elements that maintain its ecosystem health is that Solana has risen to the third place in the weekly NFT sales volume.
Although the current price movements show uncertainty, considering certain signals in the technical analysis, it is possible to obtain a clearer opinion about the direction of the price.
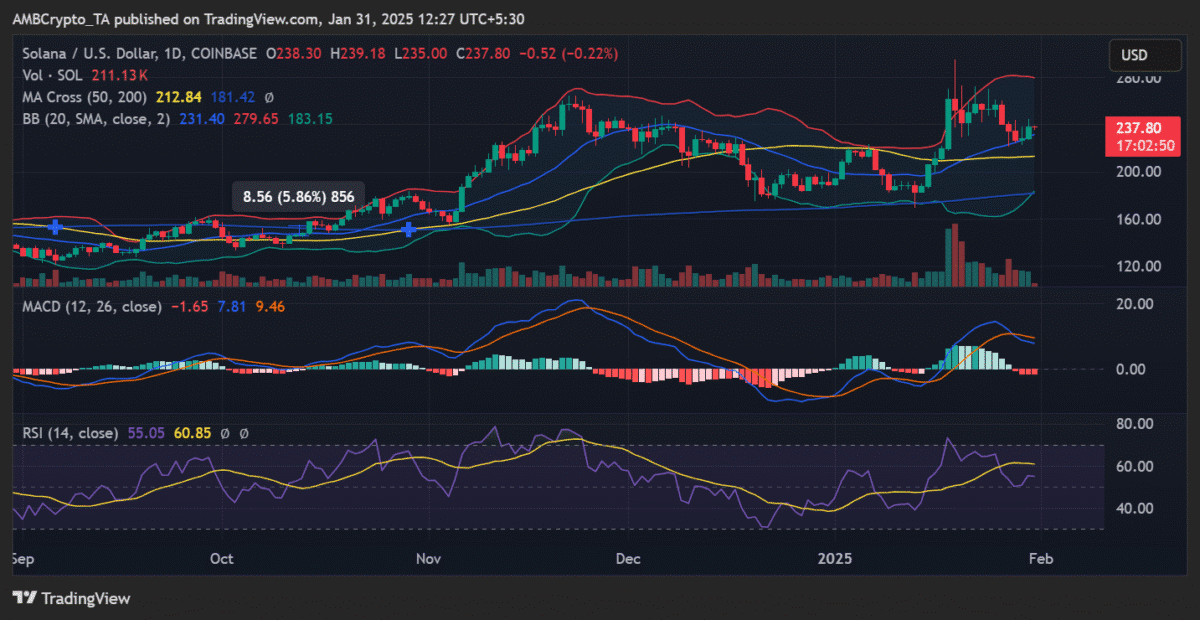
Solana’s moving averages (MA) show that the market is in a mixed structure. The 50 -day moving average is located at $ 212.84, while the 200 -day moving average is located at $ 181.42.
This positioning shows that the “Golden Cross” formation, which points to the bull market, is preserved. However, the fact that there is a downward trend in the slope of moving averages suggests that sales pressure in the short term increases.
Bollinger bands show that volatility is expanding. The upper band is located at $ 279.65, the middle band is at $ 231,40 and the lower band is located at $ 183,15. The opening of the bands indicates that a large price movement is close. However, the direction of this movement is still unclear.
Transaction volume and market momentum
Solana’s trading volume is followed by a wavy course and is currently at 211 thousand left levels. Looking at the past data, the increase in volume usually progresses in parallel with the price rise, and the volume in the consolidation process is gradually decreasing.
This may indicate that investors tend to accumulate left and the price is preparing to break a new break. When the MACD indicator is examined, it is seen that it creates a downward intersection. This indicates that sales pressure may continue in the short term, while the weakening of the momentum in histogram indicates that the decrease tendency may lose speed.
Solana Price February 2025 Critical Support and Resistance Levels
One of the most important levels determined in the technical analysis is 264.63 dollars resistance point. Current price movements show that there is a strong sales pressure on the $ 260-280 band.
Looking at the support levels, the most critical region stands out as $ 169,22. However, in order for the price to fall here, the level of $ 212, which has a 50 -day moving average, needs to be broken.
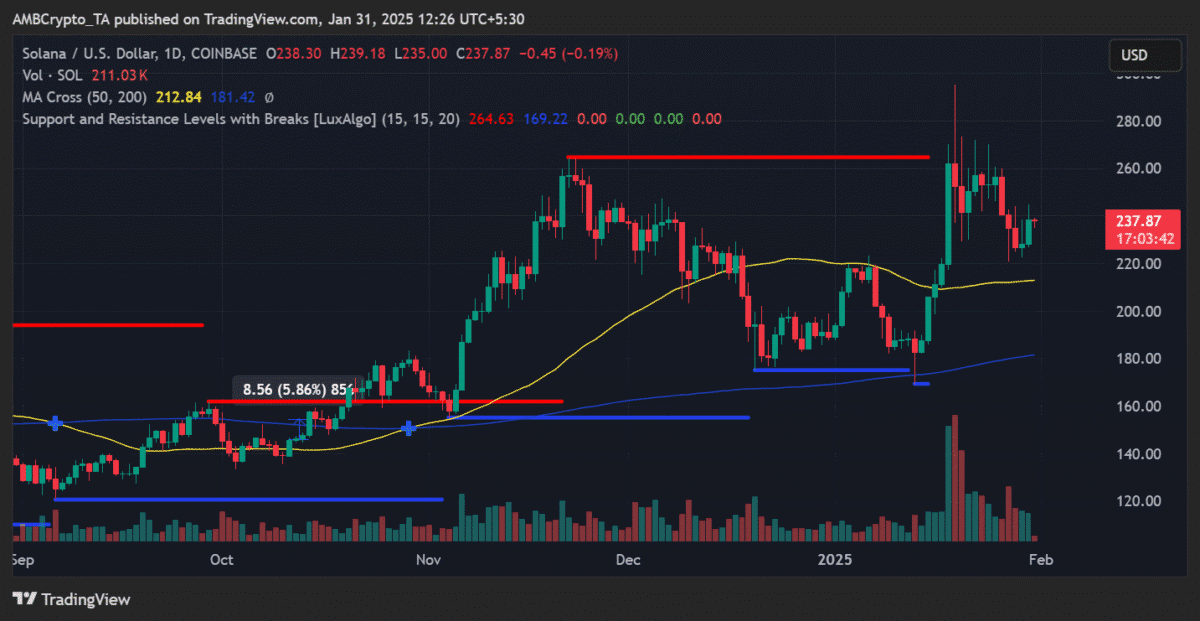
Recent price movements show that the $ 260 region constitutes a strong psychological barrier. At this level, the price was rejected several times and the sellers continue to defend this area. On the other hand, the support level of around $ 170 has not yet passed a serious test.
Therefore, solana needs to exceed $ 264 to continue its upward movement. Otherwise, the possibility of a withdrawal up to $ 212 may be on the agenda.
Solana ecosystem looks strong
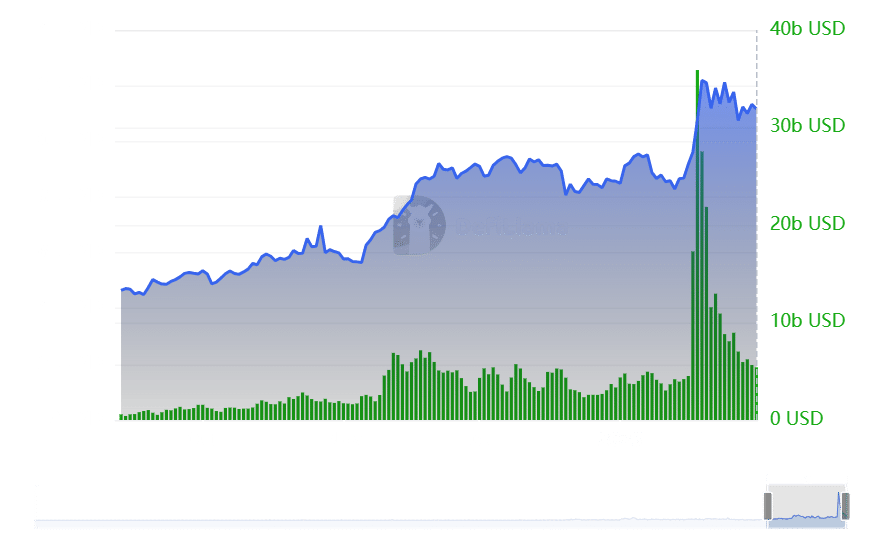
Despite the uncertainty in price movements, Solana ecosystem continues its strong stance. The total locked value (TVL) shows that the growth and investor interest in the ecosystem continues to approach $ 12 billion.
In particular, Solana NFTs continue to be one of the elements that protect the health of the ecosystem. According to the latest data, the weekly NFT sales volume reached $ 14.3 million and made Solana one of the most active block chains.
However, when short -term graphics are examined, the price of lower peaks shows that investors realize profit. This indicates that there may be fluctuation in price movements in the short term. There are two main scenarios for solana in the coming period. If the price can break the level of 264 dollars, the upward movement can be accelerated and a rise up to $ 280 may be seen.