Bitcoin (BTC) price is moving around the $30,000 low zone, encouraging traders to believe the bottom is out. But data from Glassnode warns of another eventual sale.
“Data shows that the market is preparing for a final capitulation event”
As you can follow from cryptokoin.com news, prices will reach new highs throughout 2021. The bull market enthusiasm has led to a market recession for any Bitcoin (BTC) buyers who have been buying since January 1, 2021. Data from Glassnode shows that these buyers are ‘now underwater’ and the market is poised for a final event of capitulation.
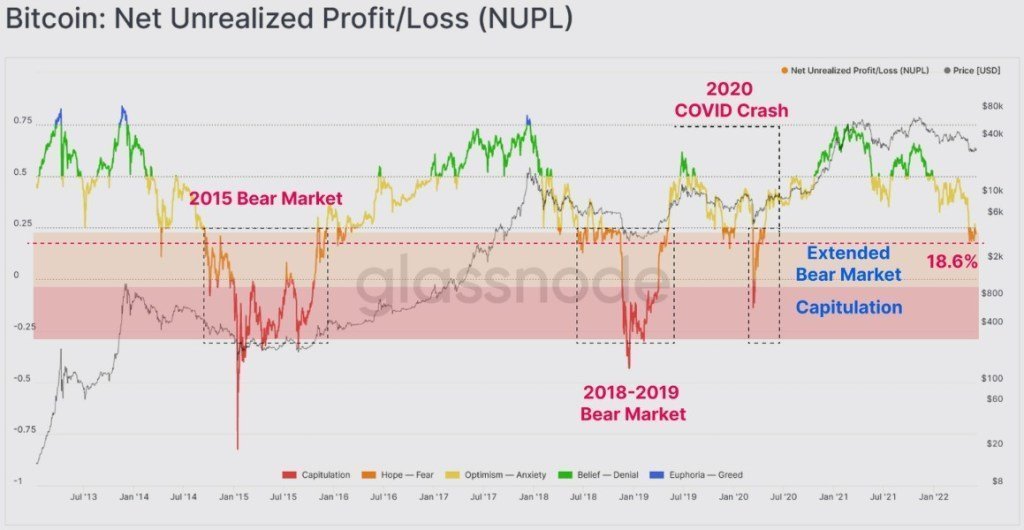 Bitcoin net unrealized profit or loss / Source: Glassnode
 NUPL, a metric that measures the network’s total unrealized profit and loss as a ratio of market capitalization, last month It shows that less than 25% of the market value is in profit, similar to a market structure equivalent to the pre-capitalization stages in the market.
Based on previous capitulation events, if a similar move occurs at current levels, Bitcoin price could drop to a price range of $20,560 to $25,700 in a “full-scale capitulation scenario”.
What is the bottom price for Bitcoin?
With the crypto market clearly trading in bear market territory, the question on everyone’s mind is “where is the bottom?” One metric that can help provide some possible guidance is the Mayer Multiple, an oscillator that tracks the ratio between price and the 200-day moving average.
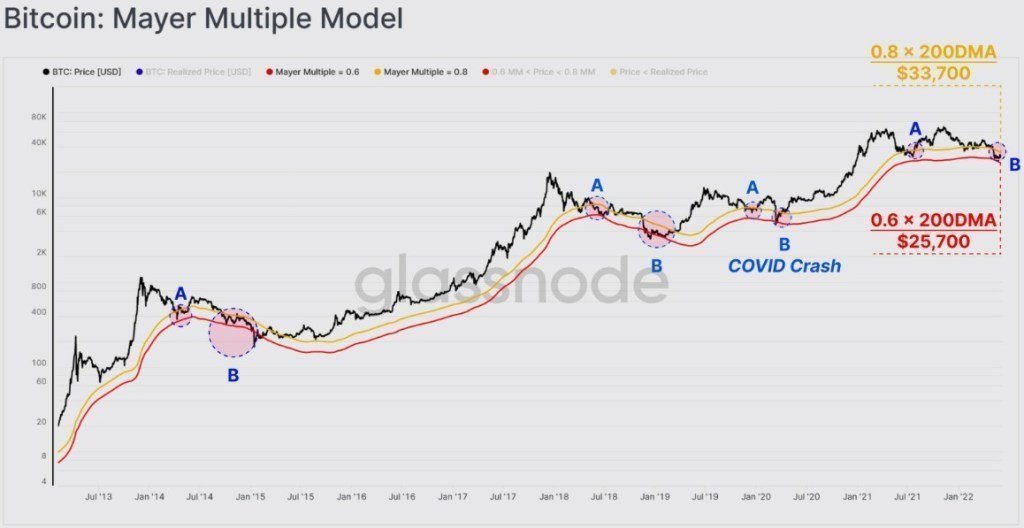 Mayer Multiple model for Bitcoin / Source: Glassnode
 According to Glassnode, in previous bear markets, ‘oversold or undervalued conditions, Mayer Multiple’ It coincided with the fall of 0.6-0.8 in ‘and this is exactly the range in which Bitcoin found itself.
Based on the price action of previous bear markets, Bitcoin’s recent trading range of $25,200 to $33,700 aligns with phase B of previous bear market cycles and could mark BTC’s low in the current cycle.
Bitcoin realization price model, with current data provided by Bitcoin data provider LookIntoBitcoin, suggesting that the realized price for BTC was $23,601 as of June 5, giving an idea of what a potential bottom price could be for Bitcoin.
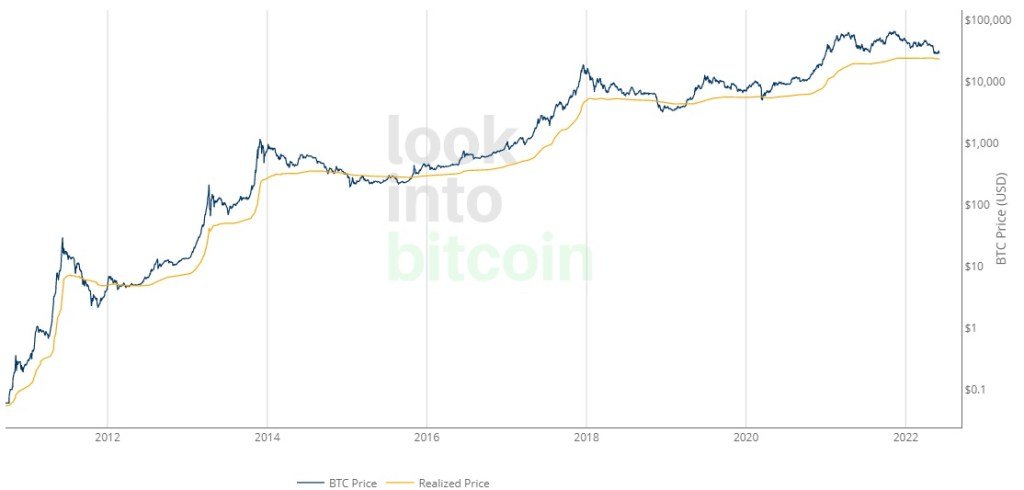 Bitcoin actual price / Source: LookIntoBitcoin
 Combining these two metrics shows that the low for BTC could occur in the $23,600 to $25,200 range.
What does short-term holder and miner capitulation indicate for Bitcoin?
In current market conditions, selling is largely dominated by short-term holders, similar to the behavior seen in the previous two extended bear markets, where long-term holders held more than 90% of market profits.
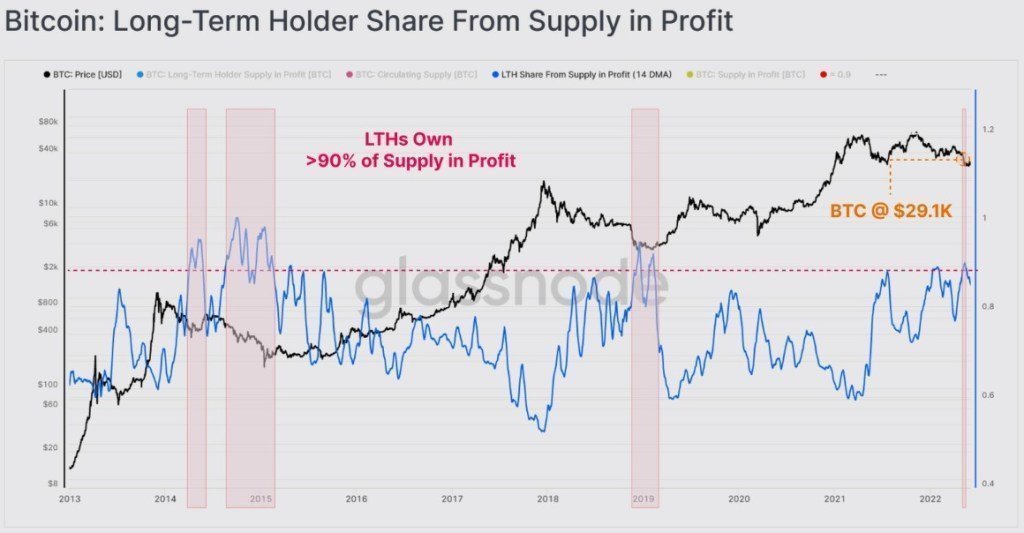 Long-term Bitcoin holders receive dividend from supply / Source: Glassnode
 Last drop below $30,000 for Bitcoin, above 90% supply percentage in profit for long-term holder group saw the rise and shows that short-term holders ‘essentially reached a pain threshold near the peak’. According to
Glassnode, miners have been net sellers in recent months as the drop in BTC has hampered the profitability of miners and has resulted in “total miner balance drops between 5,000 and 8,000 BTC per month”.
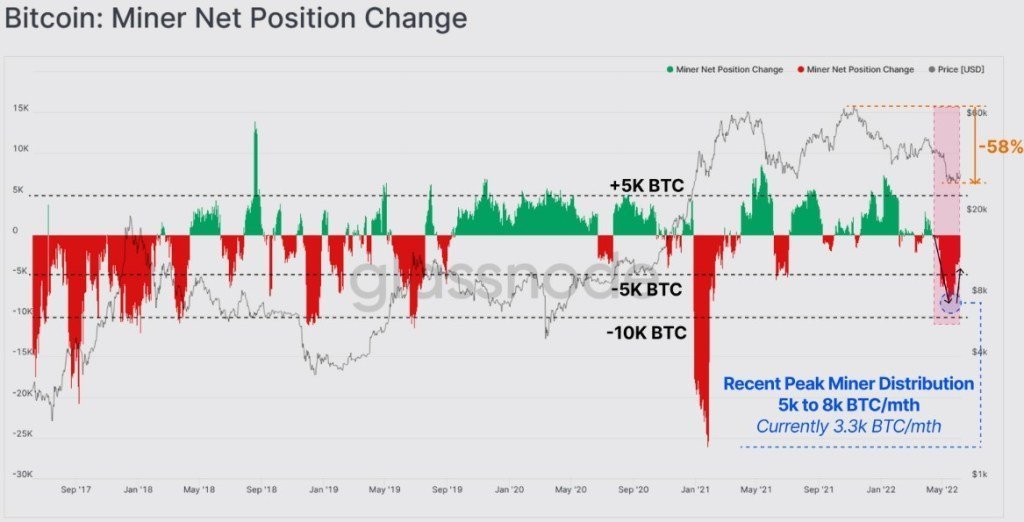 Bitcoin miner net position change / Source: Glassnode
 If the price of BTC continues to fall from here, Puell, which in the past is the ratio of Bitcoin’s daily issue value to its 365-day moving average There is no potential for an increase in miner capitulation as demonstrated by Multiple.
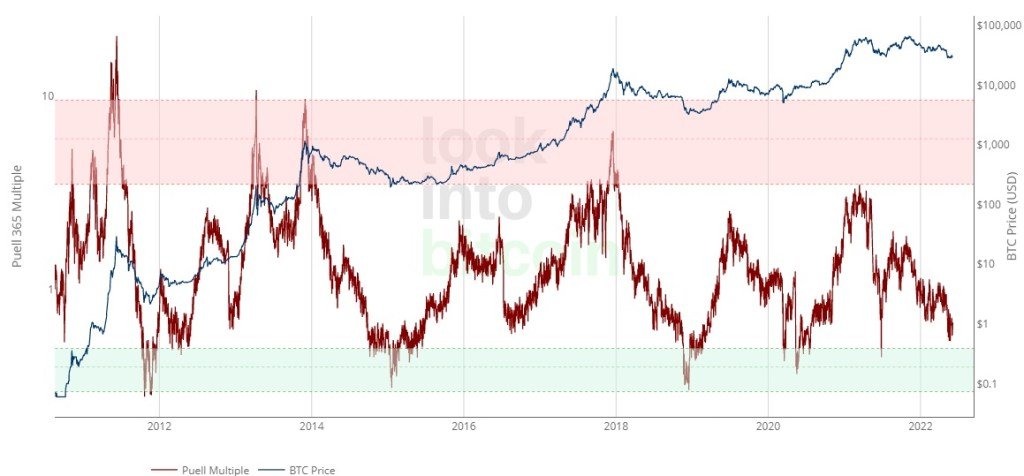 Puell Multiple vs. BTC price / Source: LookIntoBitcoin
 Historical data shows that the metric fell below 0.5 in the final stages of previous bear markets, which had not yet formed in the current cycle. Based on current market conditions, an additional 10% BTC price drop could lead to an eventual miner capitulation, similar to the price drop and sell-off seen at the peak of previous bear markets.