
The Current Trajectory of Bitcoin (BTC)

Bitcoin (BTC) is currently mirroring the trends observed during its 2017 market cycle. Despite facing significant market volatility recently, largely due to escalating tariff disputes between the United States and neighboring countries, as well as ongoing tensions with China, Bitcoin’s price has shown resilience. Notably, it is up approximately 525% from its lowest point during the FTX collapse in November 2022. In comparison, at a similar phase in the 2017 cycle, Bitcoin had increased by 533%.
Another valuable method for assessing Bitcoin’s cyclical behavior involves analyzing returns from previous all-time highs. The previous market peak occurred in April 2021, when Bitcoin reached around $64,000. Although its nominal all-time high was recorded at $69,000 in November 2021, many analysts believe that April 2021 was the true pinnacle of that cycle. Despite the ongoing geopolitical challenges, Bitcoin has exhibited impressive consistency in tracking its past cycles.
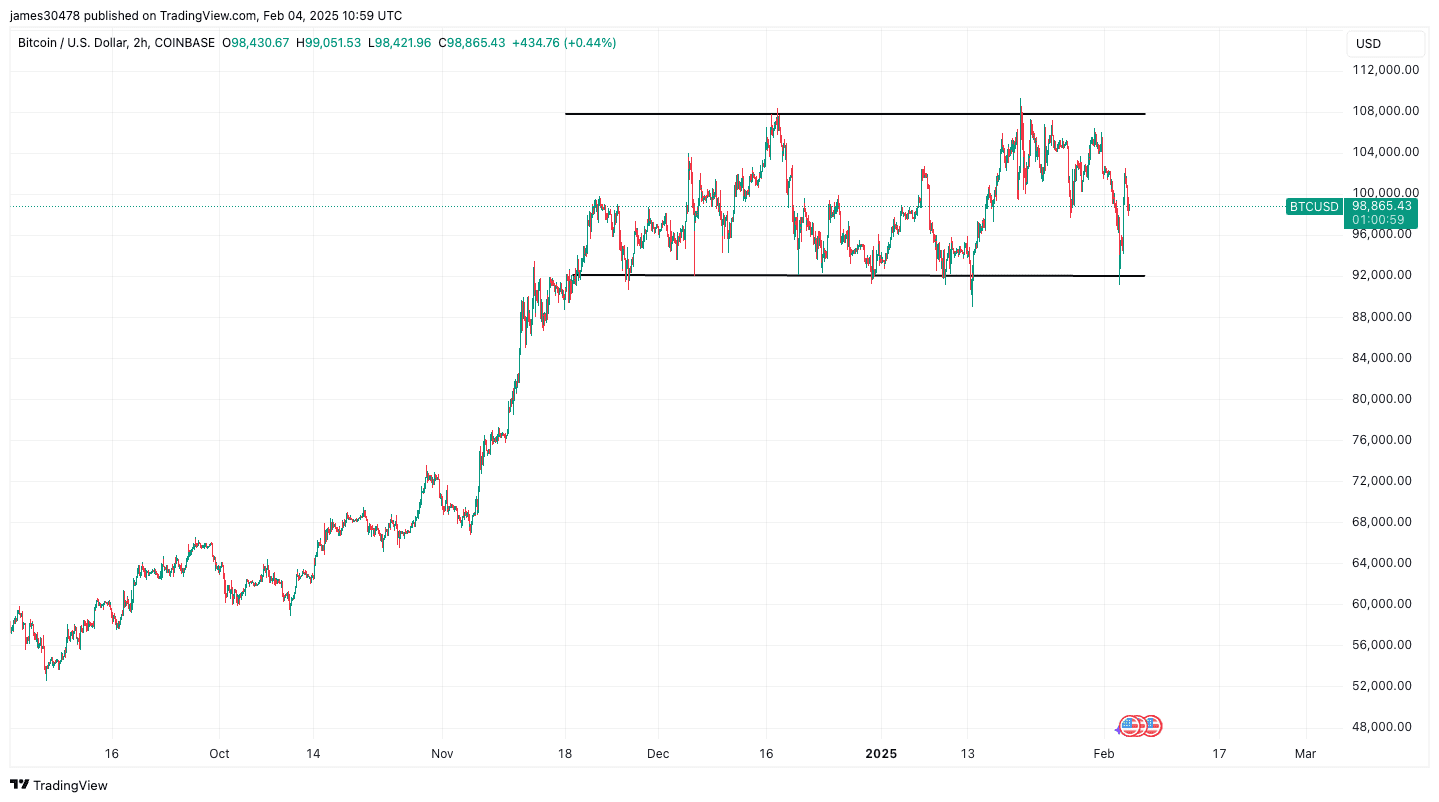
According to data from Glassnode, Bitcoin has also remained within a trading range of $90,000 to $109,000 for the last 2.5 months, effectively navigating through periods of increased market volatility. The cryptocurrency continues to test both the upper and lower limits of its current trading channel. Furthermore, earlier research conducted by CoinDesk identified $91,000 as a significant local bottom for Bitcoin.
As Bitcoin continues to evolve in this complex market landscape, investors and analysts alike will be keenly observing its movements and how they align with historical patterns.


