
Bitcoin remained strong above the $29,500 support. According to technical analysis by NewsBTC’s Aayush Jindal, if there is a clear move above the $31,500 resistance, BTC could start a big rally.
Bitcoin Back in $30,000 Zone
There was a clear move above the $30,000 resistance zone yesterday in Bitcoin. The bulls managed to push the price above the $30,500 level and the 100 hourly simple moving average. It even climbed above the $31,000 level and tested the $31,500 resistance area. A high was formed near $31,550 and then it tested the 23.6% Fib retracement level of the recent rise from the $29,200 low to $31,550 low. There is also a key bearish trend line forming with resistance near $31,400 on the hourly chart of the
BTC/USD pair. An initial resistance is near the $31,500 level. A clear move above the $31,500 resistance level could push the price higher.
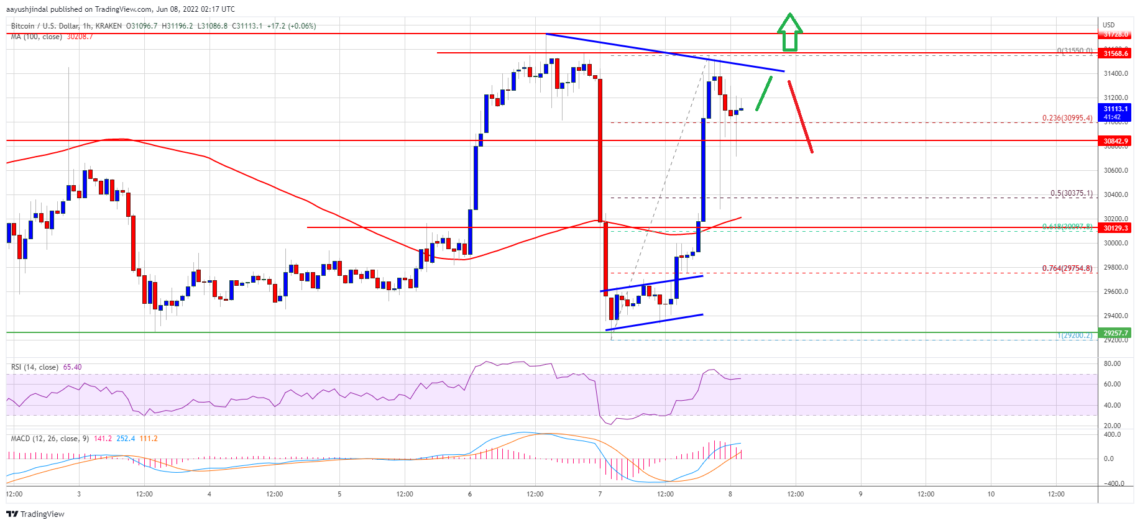
The next major resistance could be $32,200. Any further gains could change the bias and push Bitcoin price towards the $33,200 level.
Will Bitcoin Drop Again?
Jindal says that if Bitcoin fails to break past the $31,500 resistance zone, it could initiate another decline. The next major support is near the $30,175 level. This is close to the 50% Fib retracement level of the recent rise from the $29,200 low to $31,550 low. According to him, a downside break below the $30.175 support could trigger another decline. In the stated case, it could decline towards the $29,500 support zone.
What Do Technical Indicators Say?
- Hourly MACD – The MACD is now losing momentum in the bullish zone.
- Hourly RSI (Relative Strength Index) – The RSI for BTC/USD is currently well above the 50 level.
- Major Support Levels – 30.850 followed by $30.175
- Major Resistance Levels – 31400, 31500 and 32200 USD