Pi Network (Pi Coin) is perhaps the most popular Altcoin of 2025. Token price has increased by more than 200 percent in the last seven days. It reached almost $ 3 in this process. Despite these impressive rally, technical indicators show that the rise trend may be losing momentum. Crypto analyst Tiago Amaral, Pi says Coin can see a harsh correction.
PI DMI shows that buyers are still in control, but…
PI’s DMI graph shows that ADX is currently 37.6 after rising from 9 to 62.7 between yesterday and today. The average direction index (ADX) measures the power of a trend without showing its direction. The index varies between 0 and 100, and the values over 25 points to a strong train and the values below 20 point to a weak or non -trendy market.
The +DI of PI decreased from yesterday to 23.6 from yesterday to 23.6. -DI shows that the decline tendency increases from 1 to 20. In spite of this change, +DI remains on the -DI and confirms that PI is still in the rise trend. However, the narrowing of the difference between the direction indicators indicates that the bull trend lost power. If +DI continues to fall and if he descends under the DI, he may indicate that the trend is starting to reversed.
Pi Network RSI has returned to the neutral level
PI’s RSI is currently 52.2, after reaching an extremely high level of 95 yesterday and staying over 70 hours on February 26th. The relative power index (RSI) is a momentum oscillator that measures the speed and change of price movements ranging from 0 to 100.
While the values of over 70 indicate that the asset may be over -valued and a withdrawal may be experienced by pointing to excessive procurement conditions, while the values below 30 indicate the potential of recovery of prices by pointing to excessive sale conditions. A RSI between 30 and 70 is generally considered neutral and has no strong direction tendency.
 PI rsi. Source: TradingView.
PI’s RSI’s RSI is more than 70 and the peak in 95 to 52.2 after the peak, shows that the intensive print pressure has cooled. This decrease reflects the loss of ascension momentum and may indicate that PI has entered a consolidation phase. Sharp withdrawal from excessive purchase levels shows that profit intake is realized and increases the possibility of a temporary price correction. However, since the RSI is currently in the neutral region, the next price movement will depend on whether the purchase interest continues or whether the sales pressure continues to increase.
Pi Coin Price Estimation: Token can soon see 68 %correction!
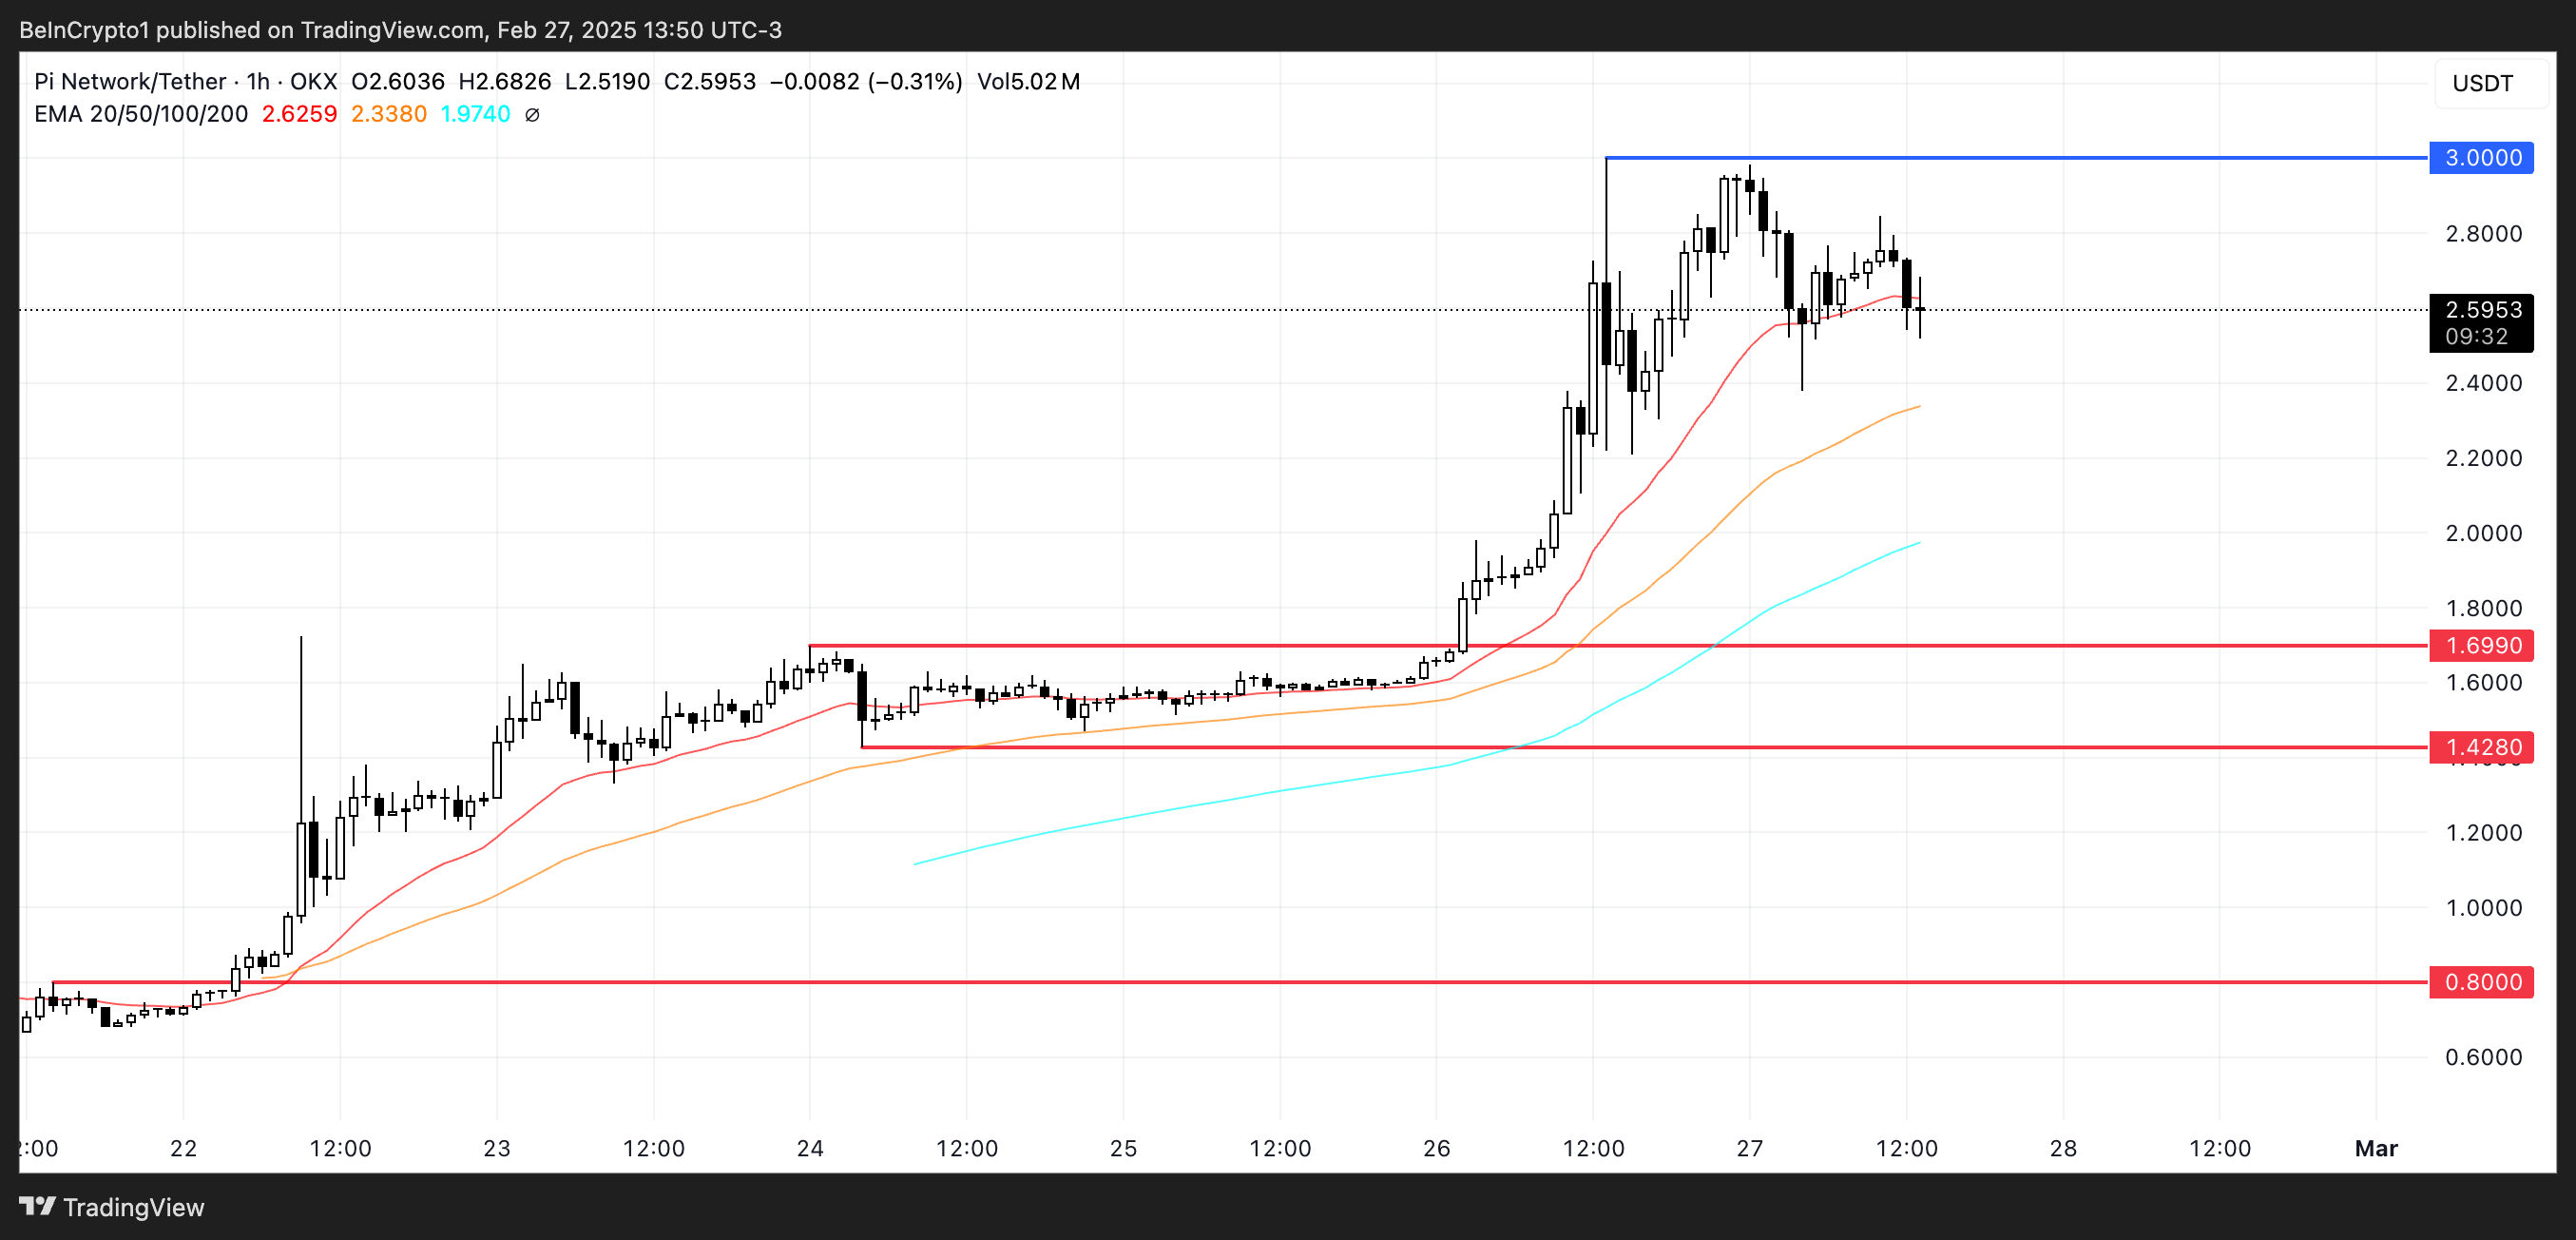
PI’s EMA lines continue to rise and short -term lines show that the rise trend is still intact by taking place on long -term lines. However, the last movement shows that as the latest DMI and RSI values confirm, this rise trend may lose momentum. The weakened procurement pressure and increasing decline tendency point to a potential change in recent positive market sensitivity. If the EMA lines continue to converge, it may indicate that a approaching trend will reversal by risking PI’s rise appearance at risk.
If Pi Coin can regain the power of the bull trend, it may first rise to test the levels above $ 3 for the first time and possibly reach $ 3.5 dollars. However, if the trend reverses, PI price support can test for $ 1.69. If this level is lost, it may continue to fall to $ 1.42. Even if this support fails, the Pi Network may drop to $ 0.8 and indicate a significant 68 %correction.
 PI Price Analysis. Source: TradingView.
The opinions and estimates in the article belong to the analyst and are not definitely investment advice. Kriptokoin.comWe recommend that you do your own research before investing.


