After Bitcoin fell about 15 percent last week, it was around $ 82,000 on Monday. Ethereum (ETH) and Ripple (XRP) follow the footprints of the BTC and decreased by approximately 20 %and 28 %, respectively. Crypto analyst According to Manish Chhetri, HMomentum indicators for two tokens continue to show weakness. This points to more correction.
BTC Price Estimation:Bitcoin price is preparing to decline more!
Bitcoin price on Sunday, the 200 -day exponential moving average (EMA) level of 85,754 dollars to decline by 6.37 %decreased. During the article, he was around $ 81,800. If the BTC continues to decline, it may extend the decline to test the low -level $ 78.258 on February 28th. A successful closing below this level will extend an additional decline to re -test the next support level from $ 73.072.
The relative power index (RSI) in the daily graph rejects the 50 neutral level last week and points to the decrease momentum. In addition, the moving average convergence deviation (MACD) also gives sales signals by showing a decrease tendency on Sunday and indicates a decrease tendency. However, if the BTC is recovered, it can extend the recovery up to $ 85,000.
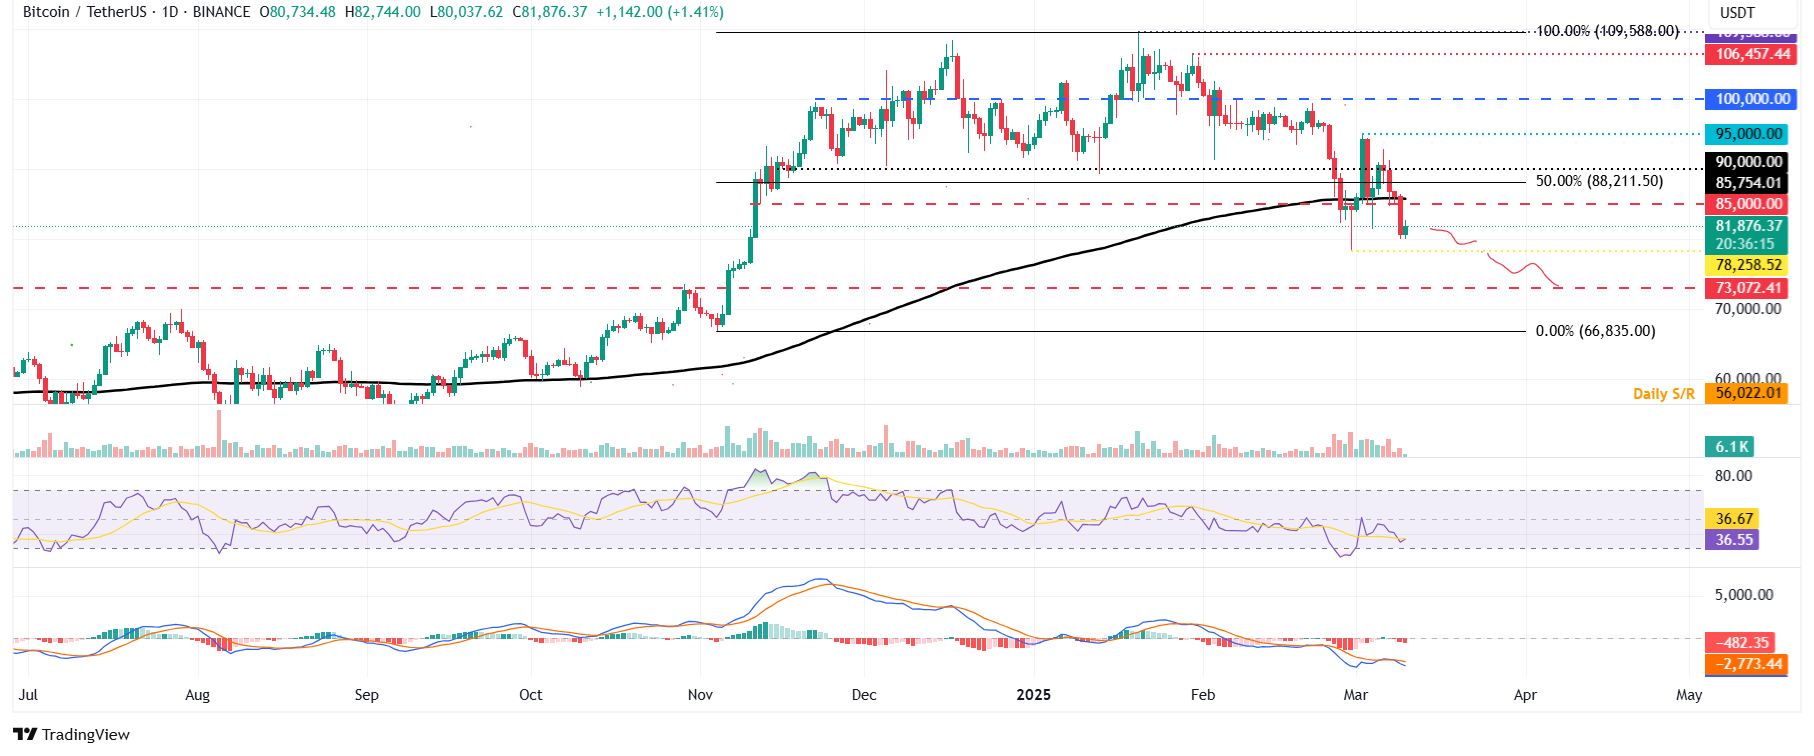 BTC/USDT Daily Graphics
ETH Price Estimation: The momentum indicator shows weakness!
Ethereum (ETH) price fell approximately 20 %last week after the support level of $ 2,125 on Sunday. At the beginning of this week, on Monday, it is traded around $ 2,051. If ETH maintains its downward momentum, it may extend the decline to re -test the weekly support level from $ 1,905.
The RSI in the daily graph is read as 35 after being rejected around 50 with neutral level last week and points to the decrease momentum. At the same time, MACD also tended to decline last week. This indicates that the decline tendency continues. On the other hand, if ETH recovers and closes above $ 2,125, it may extend the recovery to re -test the next resistance level as $ 2,359.
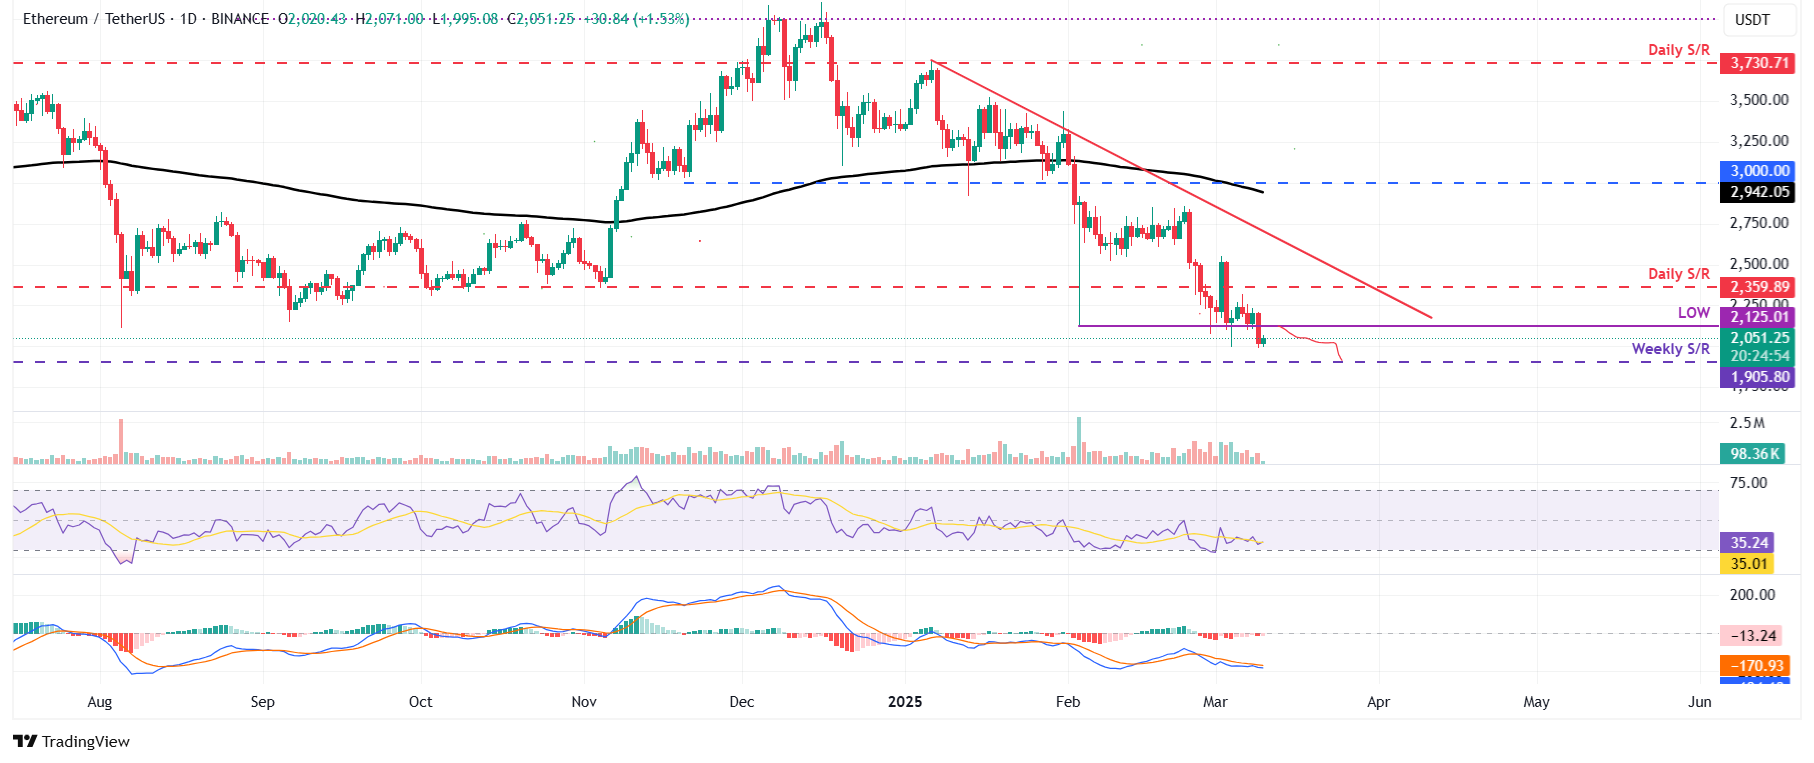 ETH/USDT Daily Graphics
XRP Price Estimation: Ripple Bears show power!
The Ripple (XRP) price was rejected around $ 3 with a key psychological level on March 3 and fell by 27 %until Sunday. During the writing on Monday, it is traded around $ 2.17. If the XRP continues to correct, it may extend the decline to re -test the daily support level at $ 1.96. A successful closing below this level will extend an additional decline to test the lowest level of February 3, $ 1,77.
RSI points to the decline momentum by taking 42 values below 50, which is the neutral level. Macd also showed a sales signal on Sunday and pointed to a decline tendency. However, if the XRP is collected, it may extend the recovery to test the next resistance level for $ 2.72.
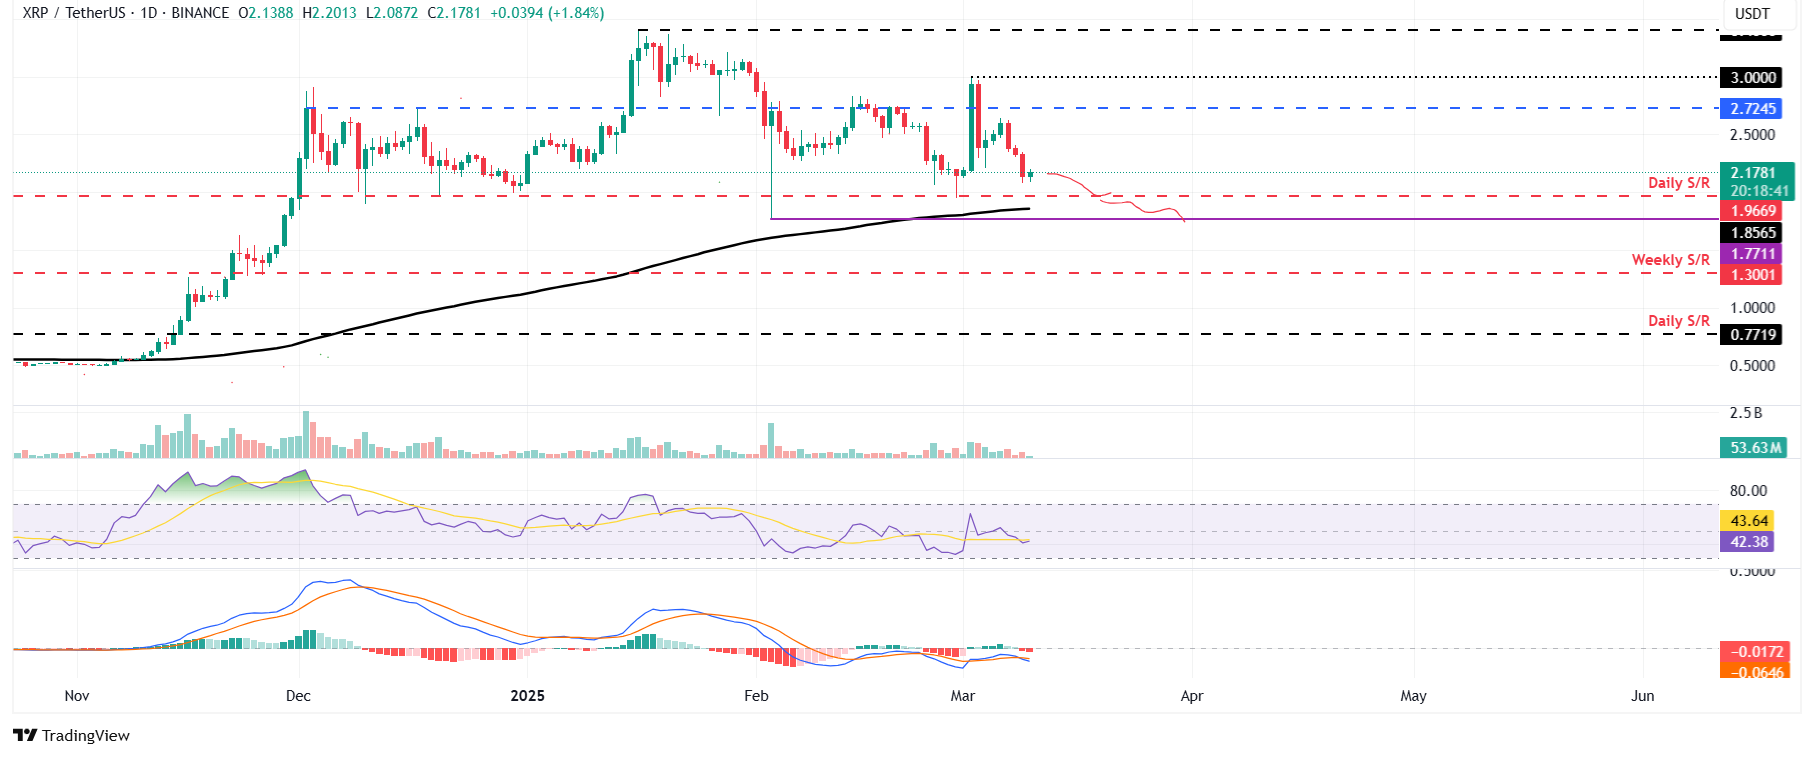 XRP/USDT Daily Graphics
The opinions and estimates in the article belong to the analyst and are not definitely investment advice. Kriptokoin.comWe recommend that you do your own research before investing.